ICG Ensemble Analyzer
The ICG Ensemble Module generates one ICG and one ECG ensemble waveform per epoch, and allows the user to score the necessary ICG landmarks.
Table of contents
Introduction
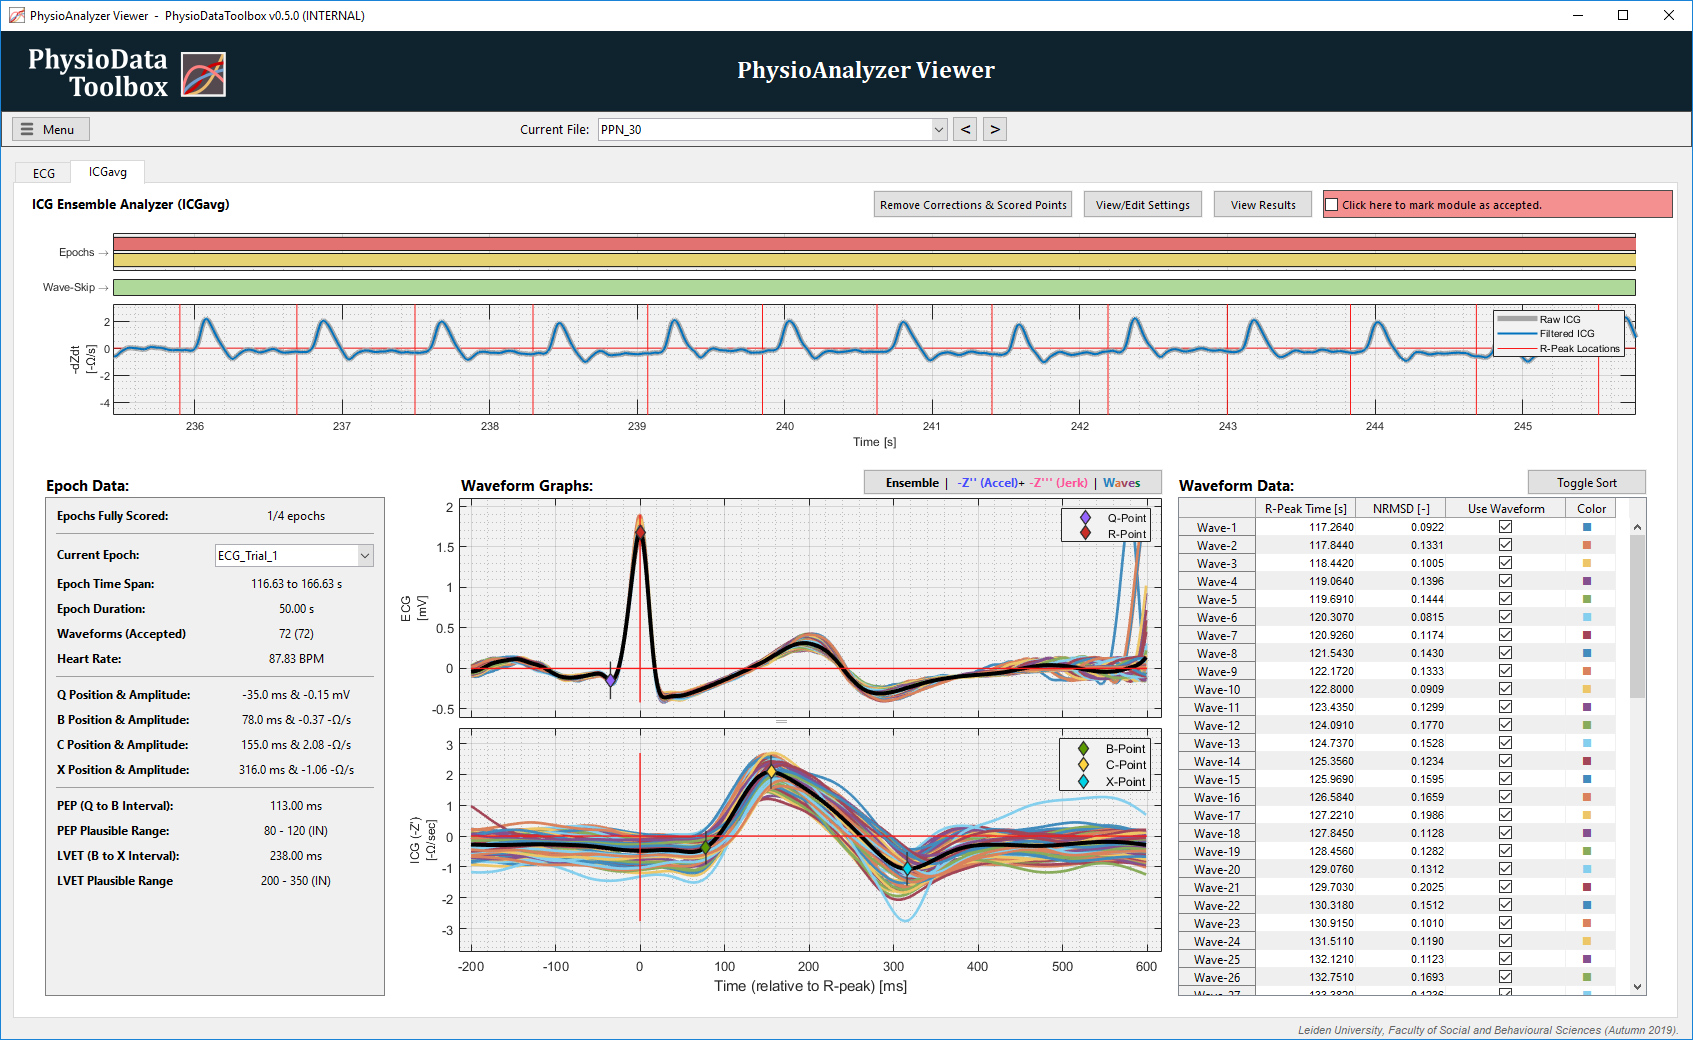
The ICG Ensemble Analyzer module performs epoch-based analysis of ensemble ICG and ECG signals, and allows the user to manually score the Q, B, C, and X points on the ensembles. In addition, the user can exclude deviant waveforms from the ensemble.
Waveforms are sections of the ICG and ECG signals that straddle each R-peak, and the ensemble is the grand average curve of the individual waveforms,
To ensemble the ICG and ECG signals, a valid ECG Signal Analyzer module must be present in the PhysioData file. The R-peak times from this ECG module, as well as the user specified waveform start and end offsets, are used to slice the ICG and ECG signals into individual waveforms. Only waveforms that completely fit inside one or more epochs are further processed. The filtered ECG signal from the ECG module is used for the ECG waveforms, and the ICG signal is taken from the user specified channel, and optionally pre-processed.
The ICG Ensemble Analyzer only analyzes the ICG (-dZ/dt) signal, the Generic Signal Analyzer module can be used to calculate descriptive statistics from the Z-signal; e.g., mean Z value per epoch. Similarly, ECG based metrics are only calculated in the ECG module, not the ICG module itself. For convenience and compatibility, consider defining the necessary epochs in the ECG module, then referring to them in the ICG and Generic Signal Analyzers. The toolbox cannot generate a -dZ/dt signal from a Z signal, but this can be done beforehand using a custom MATLAB script.
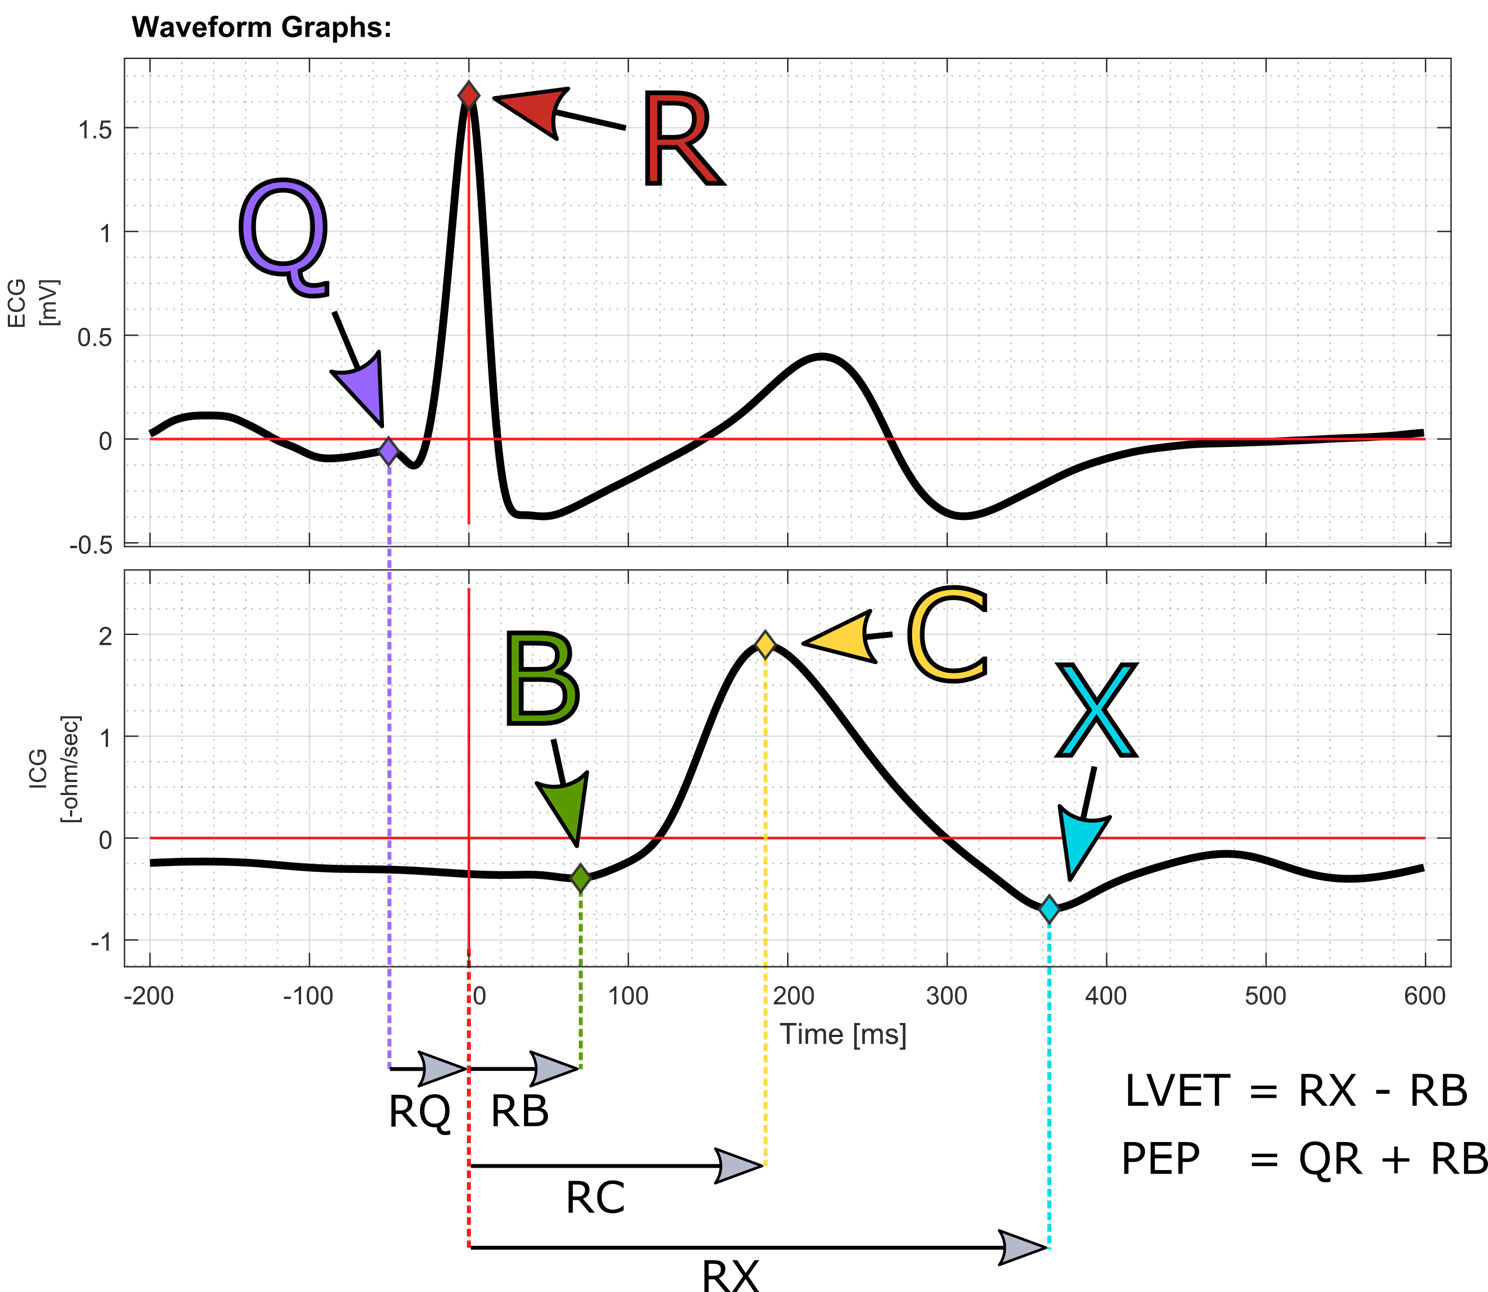
The waveform rejection criteria, and the placement strategy for the Q, B, C and X points are at the researchers’ own discretion, and fall outside of the scope of this document. Because the Q-point is used to mark the onset of the PEP, ‘R-onset PEP’ can technically be calculated by placing the Q-point at the R onset.
User Corrections
With the exception of basic pre-filtering, the ICG Ensemble Analyzer module does not allow the user to modify the ICG signal. It is, however, possible to include or exclude individual waveforms from the ensembles, and to custom place the ICG and ECG landmarks (except the R-peaks).
The Epoch Data and Waveform Data tables, and the Waveform Graphs display information about the currently selected epoch, and allow that epoch’s ensemble to be scored. To change the currently selected epoch, choose another one from the dropdown menu in the Epoch Data table, or click on the desired epoch in the epoch graph.
The filtered ECG signal and the R-peak times, and hence also the ensembles, are dependent on the linked ECG module, and are automatically updated whenever the ECG module’s data is changed.
Rejecting or Accepting Waveforms
Once a waveform is rejected, neither the ICG nor ECG waveforms corresponding to that R-peak will be used to calculate the ensemble averages of any epoch that that R-peak may be in. Rejected waves are visualized in the wave-skip graph as triangles above their R-peak times. Additionally, rejected waveforms are plotted as dashed lines in the Waveform Graphs. Individual waveforms can be rejected and included one at a time by checking or unchecking their Use Waveform box in the Waveform Data table.
The analyzer module calculates a deviation metric for each ICG waveform to facilitate the identification and rejection of abnormal waveforms. This metric, the Normalized Root Mean Squared Deviation (NRMSD) is calculated as root mean squared of the deviation between each sample of a ICG waveform \((\small ICG{i})\) and the corresponding sample of the ICG ensemble \((\small \widehat{ICG}_{i})\). The RMSD is then normalized using the range of the ensemble, as in Equation 1.
The Sort button toggles the table sort between increasing R-peak time and decreasing NRMSD.
Scoring
The Q-point can be scored by right-clicking inside the ECG waveform graph axes at the desired Q-point time, and selecting the Place Q-Point at this time from the context menu. Similarly, the B and X points can be scored by right-clicking inside the ICG waveform graph axes. All manually scored points are automatically placed on their respective ensemble curves at the sample that is closest to the user-specified time; i.e., a sampling rate of 1000 Hz allows scoring with 1 ms accuracy.
To facilitate the scoring of the ECG and ICG landmarks, the first time derivative, acceleration, and the second time derivative, jerk, of both signals are calculated. Clicking the Ensemble | Accel. + Jerk | Waves button toggles between showing the waveforms or the derivatives. As the derivatives are arbitrarily scaled to fit the ensemble curve range, they should only be used for visual aid when scoring.
Settings
The ICG Ensemble Analyzer assumes that the unit of the ICG signal is -Ω/s. If this is not the case, fill in an appropriate gain value (multiplier) to transform the signal into -Ω/s.
The auto-generated list below shows the settings available in the ICG Ensemble Analyzer module:
-
General Settings:
Name, source and epoch settings for this PhysioAnalyzer.-
Analyzer prefix (tag):
The tag (name) of this PhysioAnalyzer. The tag must be unique and start with a letter, and may only contain alphanumeric characters. -
Tag of the ECG Analyzer:
The tag of the ECG Analyzer from which the accepted R-peaks are used. -
Channel-number of signal:
The channel number (index) of the signal to be analyzed. -
Generate epochs from:
Specifies how epochs are generated.
-
-
Preprocessing Settings:
The gain is the value with which the raw -dZ/dt signal needs to be multiplied to convert it into -Ω/s.-
Gain (signal multiplier) [x]:
The gain is the value with which the raw signal is multiplied before being further processed and analyzed. -
Highpass filter [Hz]:
The high-pass filter and its cutoff frequency. -
Lowpass filter [Hz]:
The low-pass filter and its cutoff frequency.
-
-
Epoch Ensembling Settings:
Settings for generating the ensembled -dZ/dt signal, per epoch. These settings cannot be changed.-
Start of waveform vs. R-peak [s]:
The relative delay of the start of the ensembled ICG waveform, relative to the R-peak. -
End of waveform vs. R-peak [s]:
The relative delay of the end of the ensembled ICG waveform, relative to the R-peak.
-
Metrics
The auto-generated table below lists all the metrics produced by the ICG Ensemble Analyzer module.
Table 1: The metrics calculated by the ICG Ensemble Analyzer module.
| Variable: | Unit: | Description: |
|---|---|---|
| RQ | ms | Time of scored Q-Point on the ensembled ECG curve, relative to the R-Point. |
| Q_Amp | mV | Amplitude of scored Q-Point on the ensembled ECG curve. |
| RB | ms | Time of scored B-Point on the ensembled ICG curve, relative to the R-Point. |
| B_Amp | -ohm/sec | Amplitude of scored B-Point on the ensembled ICG curve. |
| RC | ms | Time of scored C-Point (dZdt-max) on the ensembled ICG curve, relative to the R-Point. |
| C_Amp | -ohm/sec | Amplitude of scored C-Point (dZdt-max) on the ensembled ICG curve. |
| RX | ms | Time of scored X-Point on the ensembled ICG curve, relative to the R-Point. |
| X_Amp | -ohm/sec | Amplitude of scored X-Point on the ensembled ICG curve. |
| HR | BPM | Average instantaneous Heart Rate, in BPM. |
| PEP | ms | The Pre-Ejection Period (PEP = RB-RQ). |
| PEPplausibility | - | The range of plausible PEP values for the given HR. |
| LVET | ms | The Left Ventricular Ejection Time (LVET = RX-RB). |
| LVETplausibility | - | The range of plausible LVET values for the given HR. |
| nWaveforms | count | Number of complete waveforms inside the epoch. |
| nAcceptedWaveforms | count | Number of accepted waveforms inside the epoch. |