ECG Signal Analyzer
The ECG Signal Analyzer performs epoch-based time-domain analysis of an ECG signal, and allows users to perform basic R-peak and IBI correction.
Table of contents
Introduction
The ECG Signal Analyzer module and its GUI can be used to process ECG signals into user-reviewed and curated R-peaks and Inter-Beat Interval (IBI) time-series. On analysis, these data are then used to extract epoch-based time-domain ECG metrics.
The R-peaks and IBIs processed by the ECG signal analyzer module can be referenced by other modules for additional analysis:
-
HRV module:
The HRV module uses the IBIs to calculate HRV metrics. -
IBI module:
The IBI module uses the R-peaks to calculate event-based heartbeat-specific IBI acceleration and deceleration. -
ICG ensemble module:
The ICG ensemble module uses the R-peaks to time-lock ECG and ICG waveforms to each heartbeat, and to calculate cardiac intervals.
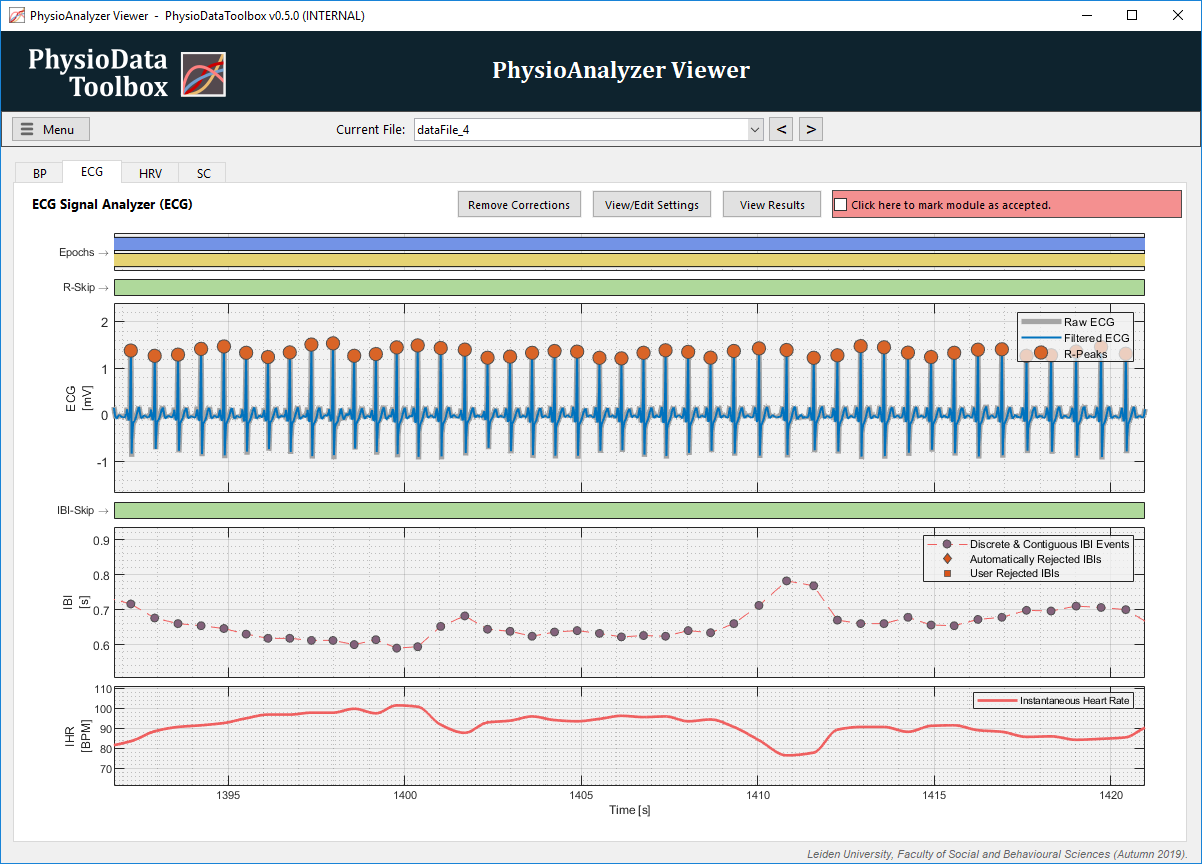
The ECG signal analyzer module GUI contains the following plots:
-
ECG (top):
Shows the raw and the filtered ECG signals. -
IBI (middle):
Shows the IBI events, and draws a dashed line between them for easier visual detection of outliers. Note, however, that the IBIs are purely discrete events, and not a continuous signal. -
IHR (bottom): Shows the continuous Instantaneous Heart Rate, as calculated from the IBIs.
User Corrections
The ECG module allows users to specify automatic feature rejection parameters in the settings, which is the easiest way to automatically reject erroneously classified R-peaks or IBIs. Additionally, users can also correct the generated data by marking two types of rejection zones: R-peak rejection zones; and, IBI rejection zones.
Data correction options of the ECG Signal Analyzer:
-
Rejecting faulty R-peaks:
To mark or unmark a section of the filtered ECG signal as an R-Peak exclusion zone, left-click in the ECG graph at the start-time of the desired section, drag the mouse, and release at the end-time of the desired section. Choose the desired action from the menu. -
Rejecting faulty IBIs:
To mark or unmark a section of the IBI time series as an IBI exclusion zone, left click in the IBI graph at the start-time of the desired section, drag the mouse, and release at the end-time of the desired section. Choose the desired action from the menu. -
Inserting R-peaks:
To manually insert an R-peak, right-click in the ECG graph, and select the desired option from the context menu.
Unlike the Generic Signal Analyzer, the raw data cannot be interpolated.
Correction Cases and Workflow
Firstly, if the ECG Signal Analyzer consistently fails to properly detect R-peaks, it is best to change the automatic rejection criteria in the Settings window. This can be done per file via the PhysioAnalyzer Viewer; or, if the issue persists across files, via the PhysioAnalyzer Configurator, and then applied to selected files.
Rejecting R-peaks and IBIs
In the case that either noise or a secondary ECG wave is erroneously detected as an R-Peak, two distinctly shorter consecutive IBIs will be visible in the plot. To correct this, insert an R-peak exclusion zone that covers the wave producing the erroneous R-peak. This will cause the faulty R-peak to be rejected, and will merge the two short IBIs into a single valid IBI.
Conversely, a missed R-peak results in a single distinctly long IBI. This can be corrected by inserting an IBI exclusion zone over the long IBI. Missed R-peaks can be caused by temporary loss of transmission when using wireless systems. In those cases, the loss of transmission produces a flat-line in the raw signal, which can sometimes be seen at the spot where the missing R-peak is expected to have been.
Please see the tutorial for more detailed instructions.
Adding R-Peaks
Users can manually add R-peaks at any time-point inside the ECG signal by right clicking inside the ECG or IBI axes, and selecting the desired option from the Add/remove user-defined R-peaks submenu:
-
Add R-peak here:
This option adds an R-peak at the time-point where the user right-clicked inside the axes. -
Add R-peak at nearest peak:
This adds an R-peak at the peak that is nearest to the time-point where the user clicked. The peak detection is performed on the filtered ECG signal (plotted in blue). -
Add R-peaks that split the gap equally.:
This estimates how many R-peaks are missing using the adjacent IBIs, then splits the gap accordingly so that each new IBI has the same value. This only works when 1, 2 or 3 IBIs are likely missing.

The user-defined R-peaks are not influenced by the R-rejection zones, and have precedence over the automatically detected R-peaks. As such, automatically detected R-peaks that are too close to the user-defined R-peaks are automatically rejected. This distance is determined by the R-separation parameter in the module’s settings, but it is always taken to be at least 100 ms. Similarly, new user-defined R-peaks have precedence over older ones, so when a new one is added, old ones that are too close are deleted.
When to Add R-Peaks
It is generally not necessary to add R-peaks if only a few are missing (compared to the length of the epoch). Furthermore, R-peaks should only be added when their locations can be visually determined, but when the detection parameters can not be tweaked further to enable the Toolbox to find them automatically. The exception to this rule is if users are specifically interested in the R-peak count, in which case adding missing R-peaks will enable the correction of that metric (even if the exact location cannot be determined).
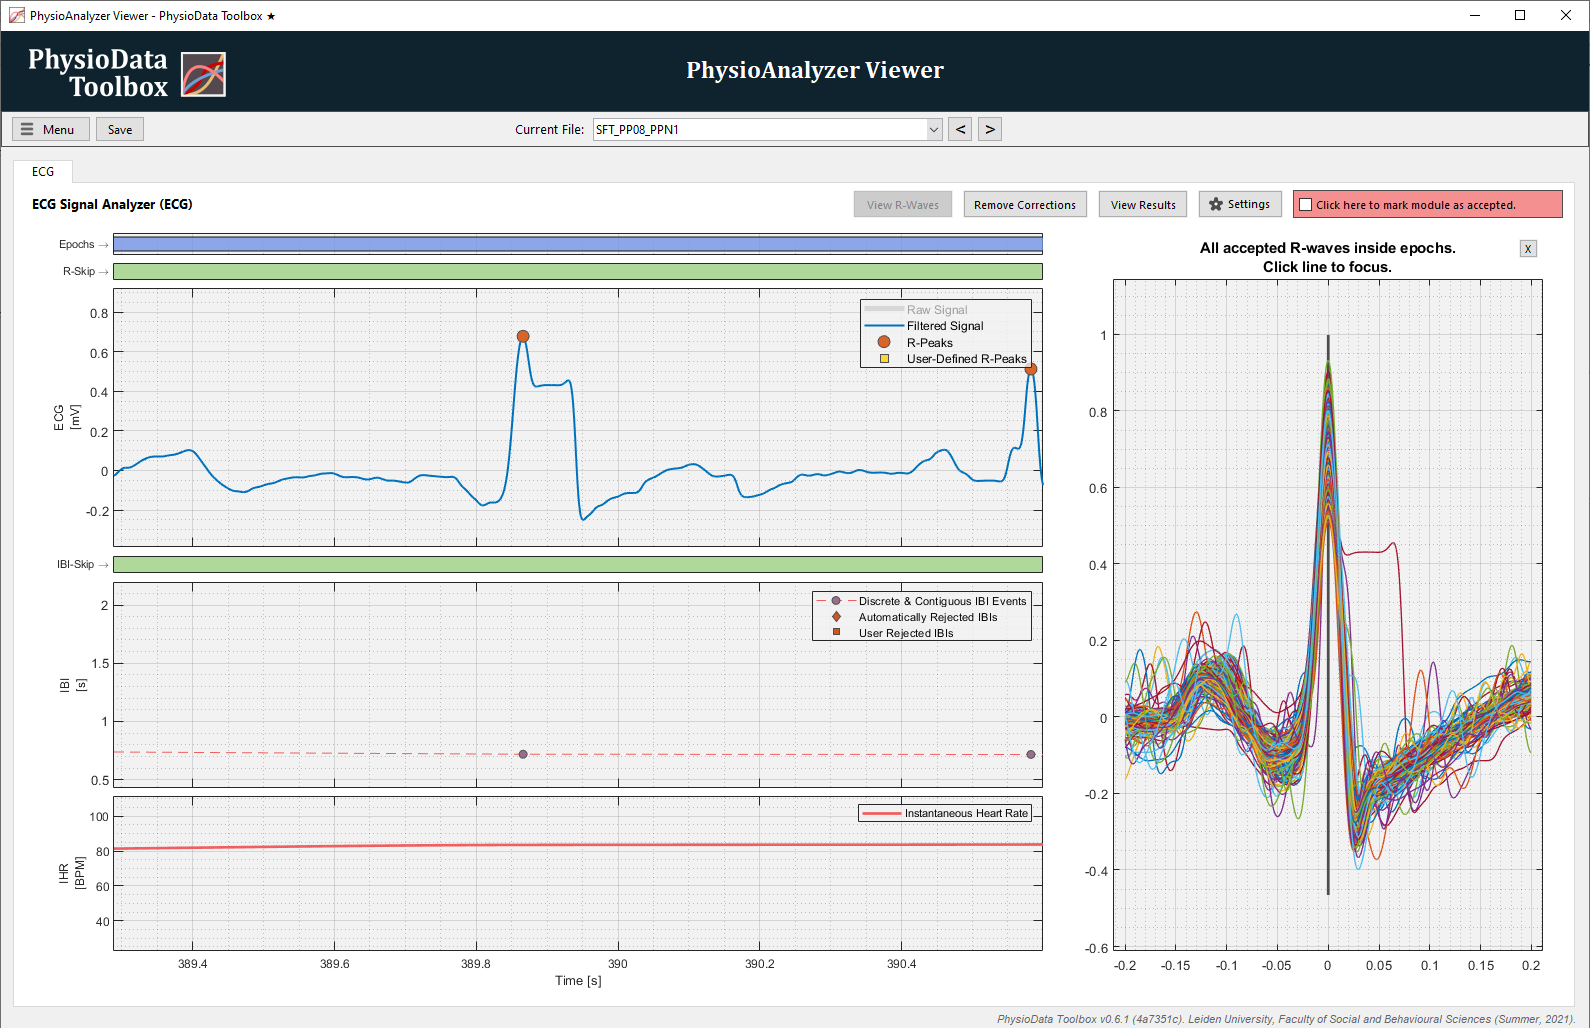
View R-Waves
Clicking on the View R-Waves button reveals the “R-waves” side-panel, which displays superimposed signal-sections (aka waves) around all R-peaks–both automatically-detected and user-defined ones, with the latter plotting as dotted lines. Only R-peaks that are located inside one or more epochs are considered. The superimposed waves are plotted relative to their R-peak locations.
This feature can be used to quickly detect whether all accepted R-peaks (inside epochs) are valid. Clicking on a wave in the side-panel will cause the main graphs to zoom in on that wave.
Processing and Analysis Pipeline
In the ECG module, the desired channel is extracted from the current file’s raw data using the user-specified channel. Then, the user-specified gain, and low-pass and high-pass filtering options are applied to produce the filtered ECG signal, on which the R-peaks are detected. From the R-Peaks that fit the relevant criteria and user-approval, all IBIs are calculated. IBIs that fall within a user rejection zone, or violate a criteria, are then filtered out. The remaining IBIs are used in the analysis, and to generate the Instantaneous Heart Rate (IHR).
IBIs are defined as having the value of the interval between the current R-peak and the previous; i.e., they are timestamped at the R-peak that ends that IBI. As such, IBIs that start outside of an epoch but end inside it are still considered part of that epoch.
Settings
The ECG signal analyzer assumes that the unit of the ECG signal is mV. If this is not the case, fill in an appropriate gain value (multiplier) to transform the raw signal into mV; e.g., if the signal is in V, the gain should be 1000. Additionally, the gain can be used to flip the ECG signal if necessary. Since the toolbox cannot detect downwards pointing R-waves, ‘upside-down’ ECG signals must be flipped by applying a negative gain.
The auto-generated list below shows the settings available in the ECG Signal Analyzer module:
-
General Settings:
Name, source and epoch settings for this PhysioAnalyzer.-
Analyzer prefix (tag):
The tag (name) of this PhysioAnalyzer. The tag must be unique and start with a letter, and may only contain alphanumeric characters. -
Channel-number of signal:
The channel number (index) of the signal to be analyzed. -
Generate epochs from:
Specifies how epochs are generated.
-
-
Preprocessing Settings:
The gain is the value with which the raw ECG signal needs to be multiplied to convert it into mV.-
Gain (signal multiplier) [x]:
The gain is the value with which the raw signal is multiplied before being further processed and analyzed. -
Highpass filter [Hz]:
The high-pass filter and its cutoff frequency. -
Lowpass filter [Hz]:
The low-pass filter and its cutoff frequency.
-
-
ECG Feature Detection Settings
Parameters for automatically rejecting R-Peaks and IBIs. Tick the checkboxes to enable the criteria.-
Minimum R-peak value [mV]:
Peaks in the ECG signal below this level are not classified as R-Peaks. -
Maximum R-peak value [mV]:
Peaks in the ECG signal above this level are not classified as R-Peaks. -
Minimum distance between R-peaks [s]:
Only the highest peaks in the ECG signal within this distance of other peaks are classified as R-Peaks. -
Minimum IBI value [s]:
IBI’s with a value lower than this parameter are automatically rejected. -
Maximum IBI value [s]:
IBI’s with a value higher than this parameter are automatically rejected.
-
Metrics
The auto-generated table below lists all the metrics produced by the ECG Signal Analyzer module.
Table 1: The metrics calculated by the ECG Signal Analyzer module.
| Variable: | Unit: | Description: |
|---|---|---|
| HR_mean | BPM | Mean of the continuous Heart Rate, as interpolated from the accepted IBI data points. |
| R_peakCount | count | Count of accepted R-peaks inside current epoch, including user-defined added R-peaks. |
| R_peakUserDefinedCount | count | Count of user-defined R-peaks inside current epoch. |
| IBI_mean | s | Arithmetic mean of the accepted discrete IBIs. IBI values are defined as: IBI(n) = Rt(n)-Rt(n-1), and are timestamped using: IBIt(n) = Rt(n). |
| IBI_weighted_mean | s | Self-weighted mean of the accepted discrete IBIs; i.e., sum(IBIs.^2)/sum(IBIs). |
| IBI_min | s | Min value of the accepted discrete IBI data points. |
| IBI_max | s | Max value of the accepted discrete IBI data points. |
| IBI_std | s | Standard Deviation of the accepted discrete IBI data points (SD normalized by (N-1), where N is the sample size). |
| IBI_count | count | Count of accepted IBI data points inside current epoch. |
| IBI_coverage | % | The percentage-wise IBI coverage of the epoch; i.e., 100*(sum of the IBIs)/(Epoch Duration). |
| HRV_rmssd | ms | The Root Mean Squared of the Differences between Successive IBIs (nonadjacent IBIs disregarded). |
| HRV_ssdCount | count | Count of succesive IBIs inside current epoch. Nonadjacent IBIs are not considered succesive. |
| HRV_pNN20 | % | Percentage of absolute differences between successive IBIs that are greater than 20 ms. |
| HRV_pNN50 | % | Percentage of absolute differences between successive IBIs that are greater than 50 ms. |
Note that the ECG module does not detrend the IBIs, as opposed to the HRV module, which does detrend the IBIs and calculates similar metrics on the detrended IBI instead.
Resampled Signals
When exporting the resampled epoch signals, the ECG Signal Analyzer resamples and extracts the filtered IHR signal.