Blood Pressure Analyzer
The Blood Pressure Analyzer extracts the systolic, diastolic and mean arterial blood pressures, as well as the pulse, from a continuous blood pressure signal, and calculates descriptive statistics for each epoch.
Table of contents
Introduction
The Blood Pressure (BP) Analyzer module processes a raw BP signal, and extracts and visualizes its basic components. Subsequently, the module can generate and export descriptive statistics or resampled signals, per epoch.
The components extracted by the module are:
-
Systolic Points and Signal:
The systolic points are the peaks in the Blood Pressure signal. They occur once per heart beat and determine the Systolic Blood Pressure (SBP). The continuous SBP signal is generated by interpolating the systolic points. -
Diastolic Points and Signal:
The diastolic points are valleys in the Blood Pressure signal. They occur immediately prior to the corresponding systolic point, and determine the Diastolic Blood Pressure (DBP). The continuous DBP signal is generated by interpolating the diastolic points. -
Mean Arterial Pressure:
The Mean Arterial Pressure (MAP) is calculated by combining the continuous SBP and DBP signals using the formula below.
- Pulse:
The pulse is an estimation of the instantaneous heart rate, and is calculated using the intervals between the systolic points.
The module is designed to analyze BP signals from traditional CNAP (Continuous Noninvasive Arterial Pressure) systems. These systems combine finger sensors and traditional NBP (Noninvasive Blood Pressure) cuffs to produce a continuous BP signal, albeit with occasional calibration artifacts. The BP Analyzer module includes several methods of automatic artifacts rejection, which can be tweaked and manually overridden by the user (see the User Corrections section).
BP Artifacts and CNAP Events
The BP Analyzer module features several artifact and CNAP event detection methods. In the current version of the Toolbox, the Finger Switch and NBP Cuff Inflation events are only available when using the BIOPAC NIBP100E system, and using the File Converter to convert the resulting AcqKnowledge file.
Once an artifact is enabled for detection, and detected, it will be visualized in the BP Events graph. Sections of the BP signal that were rejected for processing are missing in the Filtered BP plot but still shown in the Raw BP plot. See the figure below.

Flatlines
CNAP recording often contain occasional flatlines caused by sensor calibration events, which temporarily renders the BP signal unusable.
Finger Switch Events
The finger switch event indicates a switch in the CNAP finger sensor (or a restart using the same finger). This event renders the BP signal temporarily unusable, and is usually visible in the BP signal as a series of calibration flatlines.
The Toolbox defines the finger switch event as starting at one of the following AcqKnowledge events:
BPI-measurement on left finger.BPI-measurement on right finger.ME-restart on same finger.
The end is defined as one of the following, whichever comes first after the start, but no later then 100 seconds after:
BPI-measurement on left finger.BPI-measurement on right finger.ME-restart on same finger.ME-CNAP calibration interval started.ME-NBP measurement started.
If no corresponding end is found, the finder switch event defaults to a duration of 25 seconds.
NBP Cuff Inflation Events
The CNAP system occasionally uses the NBP cuff to determine the blood pressure, which is then crosschecked with the finger sensor reading to ensure accuracy. This event is usually visible as a narrowing BP signal that diminishes into a short almost flat dip before slowly recovering.
The Toolbox defines the NBP cuff inflation event as spanning from each ME-NBP measurement started AcqKnowledge event, to the subsequent ME-NBP Measurement Events NBP measurement finished event, but only if it occurs no later then 100 seconds after. If no corresponding end event is found, the NBP cuff inflation event defaults to a duration of 60 seconds.
User Corrections
The BP Analyzer module allows the users to define two correction zones:
-
Rejection Zones:
Rejection zones prevent the Toolbox from detecting systolic and diastolic peaks inside the zone. -
Acceptance Zones:
Acceptance zones override the rejection zones automatically generated from the detect BP events, and forces the module to detect systolic and diastolic peaks inside the zone.
The correction zones can be used to remove faulty sections, such as those caused by movement artifacts, or reintroduce sections erroneously rejected by the module. Before using correction zones, it is advisable to tweak the settings for optimal performance for the given file.

Processing and Analysis Pipeline
The BP module pre-processes data as follows:
- The raw BP signal is fetched from the specified channel, multiplied by the specified gain, and–if enabled–low-pass filtered using the specified cutoff frequency (filter info). This produces the filtered BP signal.
- The rejection mask, which indicates the sections of the BP signal that should not be analyzed, is generated by:
- Parsing the user-activated CNAP events, which creates the cnap-events rejection mask.
- Running the filtered BP signal through a custom flatline detection algorithm, which produces the flatline rejection mask.
- Parsing the user rejection zones into the user rejection mask, and the user acceptance zones into the user acceptance mask.
- Combining the rejection masks using an
ORoperation, and combining the product with the user-acceptance-mask using aNOToperation.
- Before systolic peak detection, a copy is made of the filtered BP signal, which is then preprocessed to remove sections where no systolic peaks are expected. This speeds up and robustifies peak analysis. The resulting signal is the systolic BP signal. The preprocessing:
- Extracts a moving max from the filtered BP signal, using a window length equal to user-specified Minimum IBI. The user-specified systolic peak allowance is then subtracted from the result.
- Applies a moving mean to the result with a window length equal to twice the minimum IBI. This produces the systolic peak minimum height.
- On the systolic BP signal, sections below the systolic peak minimum height and sections demarked by the rejection mask are set to NaN.
- Peak detection is performed on the resulting systolic BP signal to find the systolic peaks. A minimum peak separation equal to minimum IBI is enforced.
- The diastolic points are detected by finding the the lowest or last valleys between the systolic points, but only if they lie no earlier than the user-specifiable maximum diastolic point lead setting relative to the next systolic point, and no earlier then the previous systolic point. Valleys covered by the rejection mask are not considered.
- The systolic and diastolic peaks are linearly interpolated to create the systolic and diastolic signals. Interpolation occurs at the native sampling frequency.
- The Mean Arterial Pressure (MAP) signal is calculated using Equation 1.
- The Pulse is estimated by analyzing the intervals between the systolic peaks; aka the IBIs. These IBIs are filtered using the user-specified minimum and maximum IBIs, and outliers are removed using MATLAB’s hampel filter (k = 10, nSigma = 4). The remaining IBIs are transformed into BPM and linearly interpolated at 20 Hz to create the pulse signal.
The custom flatline detection algorithm works by:
- Decimating the signal to 20 Hz.
- Applying a moving variance (
movvar) to the filtered BP signal using a window length equal to the specified minimum IBI setting. - Applying a moving median absolute deviation (
movmad) to the result, using the same window length. - Applying a less-then threshold to the result of the previous step, generating the flatline mask. The threshold is defined as the specified flatline sensitivity multiplied by 0.007, which places the empirically determined nominal sensitivity value at 10.
- The resulting flatline mask is dilated by 1 second. Subsequently, gaps in the mask smaller then 4* seconds are merged.
- The mask is interpolated to the native time vector using the nearest neighbor method.
During epoch analysis, standard metrics calculated using the systolic and diastolic points and the SBP, DBP and MAP signals. Additionally, the rejection mask is analyzed to give an indication of missing data.
Settings
The BP assumes that the unit of the BP signal is mmHg. If this is not the case, fill in an appropriate gain value (multiplier) to transform the raw signal into mmHg.
The auto-generated list below shows the settings available in the Blood Pressure Analyzer module:
-
General Settings:
Name, source and epoch settings for this PhysioAnalyzer.-
Analyzer prefix (tag):
The tag (name) of this PhysioAnalyzer. The tag must be unique and start with a letter, and may only contain alphanumeric characters. -
Channel-number of signal:
The channel number (index) of the signal to be analyzed. -
Generate epochs from:
Specifies how epochs are generated.
-
-
Preprocessing Settings
Settings for processing the raw blood pressure signal. This module assumes that the signal is in mmHg, if it is not, fill in a multiplier to convert it (e.g. 100).-
Gain (signal multiplier) [x]:
The gain is the value with which the raw signal is multiplied before being further processed and analyzed. -
Lowpass filter [Hz]:
The low-pass filter and its cutoff frequency.
-
-
Calibration and BP Event Detection Settings:
The Toolbox can automatically detect and exclude CNAP calibration flatlines in the BP signal. Additionally, if a BIOPAC NIBP100E was used, BP artifacts precluding proper analysis can be parsed and be removed.-
Automatic flatlines detection:
The sensitivity of the automatic calibration detection. -
Detect and remove CNAP events:
The events reported by the CNAP BP machine that are to be automatically rejected.
-
-
IBI and BP Peak Parameters:
To increase robustness, the Toolbox automatically applies a minimum separation criteria to the detected systolic peaks, and an additional maximum IBI when calculating the pulse. Diastolic points must precede systolic peaks, but by no more then the maximum diastolic lead set below.-
Min. IBI and sys. peak separation [s]:
Systolic distance and IBI value must be larger then this. -
Maximum IBI value [s]:
IBIs with a duration larger then this value are rejected. -
Max. diastolic point lead [s]:
The max lead of the diastolic point, relative to the systolic peak. -
Systolic peak allowance [mmHg]:
The allowance for detecting the systolic peaks. -
Diastolic point classification:
The diastolic point can be classified as either the lowest valley or the last valley before corresponding systolic point.
-
Metrics
The auto-generated table belows lists all the metrics produced by the Blood Pressure Analyzer module.
Table 1: The metrics calculated by the Blood Pressure Analyzer module.
| Variable: | Unit: | Description: |
|---|---|---|
| Min_Sys_BP | mmHg | The minimum systolic blood pressure, per epoch. |
| Max_Sys_BP | mmHg | The maximum systolic blood pressure, per epoch. |
| Mean_Sys_BP | mmHg | The mean systolic blood pressure, per epoch. |
| Count_of_Sys_Points | - | The number of systolic peaks detected inside the epoch. |
| Min_Dia_BP | mmHg | The minimum diastolic blood pressure, per epoch. |
| Max_Dia_BP | mmHg | The maximum diastolic blood pressure, per epoch. |
| Mean_Dia_BP | mmHg | The mean diastolic blood pressure, per epoch. |
| Count_of_Dia_Points | - | The number of diastolic valleys detected inside the epoch. |
| Min_MAP | mmHg | The minimum MAP (Mean Arterial Pressure), per epoch. |
| Max_MAP | mmHg | The maximum MAP (Mean Arterial Pressure), per epoch. |
| Mean_MAP | mmHg | The mean MAP (Mean Arterial Pressure), per epoch. |
| Mean_Pulse | BPM | The mean of the interpolated pulse, as estimated from the intervals between the systolic peaks, per epoch. |
| Pulse_Coverage | % | The percentage of the epoch for which there is (interpolated) pulse data. |
| Missing_Data | % | Percentage of missing BP data (either due to calibrations, BP events, or user rejection), per epoch. |
Resampled Signals
When exporting the resampled epoch signals, the Blood Pressure Analyzer resamples and extracts the filtered BP signal, the systolic BP signal, the diastolic BP signal, and the MAP signal.
Tips and Notes
Tweaking the Settings
Below are examples of parameter-tweaks for optimizing the processing of the BP signal given various situations.


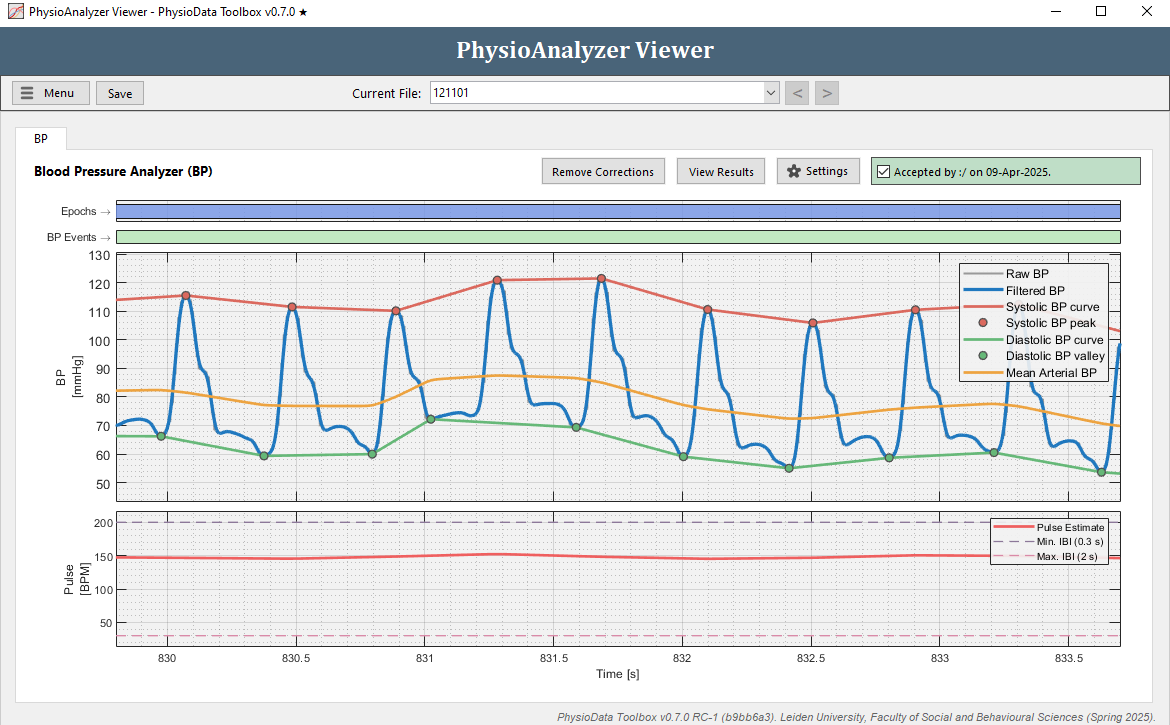
Lowest vs. Last Diastolic Valley
In Figure 1, notice how just after 831 seconds, the lowest valley is classified as the diastolic point, not the last valley before the systolic point. If this is undesirable, change the diastolic point classification setting to last instead of lowest. Alternatively, if the data allows, the maximum diastolic lead setting can be decreased so that earlier valleys are not considered.
Performance Issues
This module features multiple complex calculation and analyzes the signal at the original sampling frequency. As such, if the sampling frequency is high and/or the recording long, the Toolbox may become sluggish. This will be especially noticeable on older computers. If unworkable, consider resampling the data to a lower sampling rate (e.g. 250 Hz) in AcqKnowledge before Converting it for use in the Toolbox. More information can be found on section on BIOPAC File Conversion.
Fast-Mode
This module features Fast-Mode interaction, which helps speed up the addition of inclusion zones. Note, acceptance zones cannot be added in Fast-Mode. Consider using Fast-Mode when you need to add a considerable amount of rejection zones.
Example Files
The example files included with the Toolbox contain BP data measured using a Finapres system. These files can be used to assess the BP module.