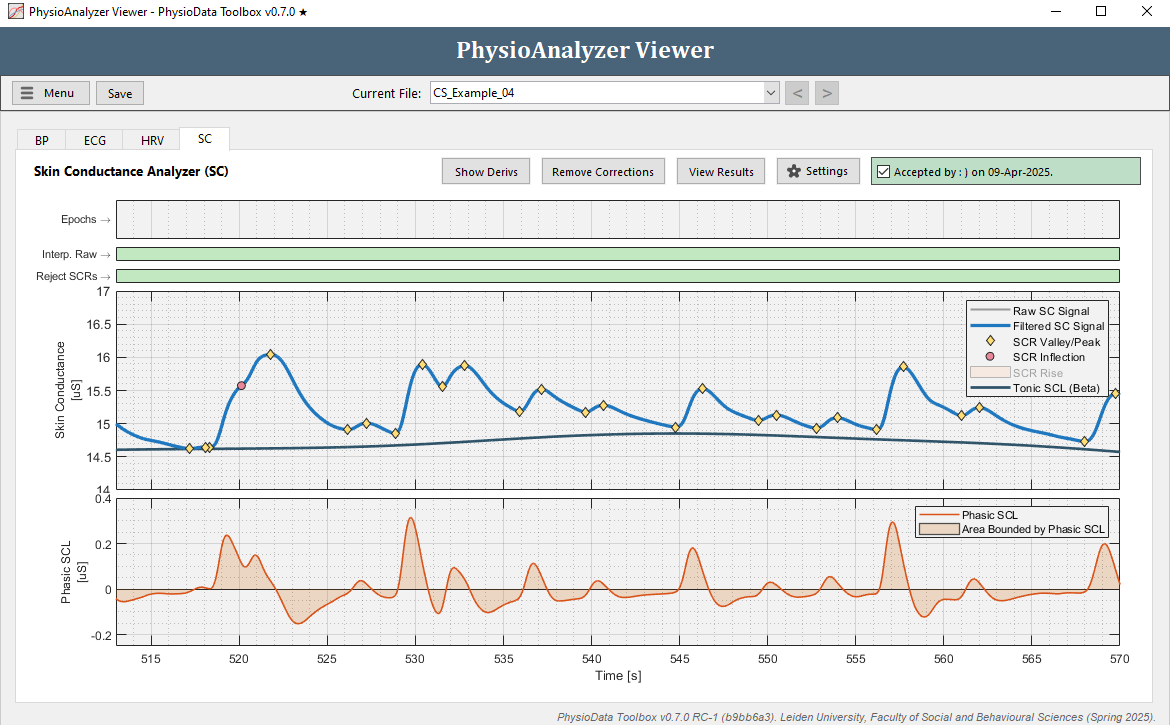
Skin Conductance Analyzer
Preprocesses a Skin Conductance signal, and extracts tonic and phasic components, as well as SCRs (Skin Conductance Responses).
Table of contents
Introduction
The Skin Conductance Analyzer can be used to: processes Skin Conductance Level (SCL) data; extract Tonic and Phasic SCL components; and, detect and analyze Skin Conductance Responses (SCRs).
User Corrections
The Skin Conductance Analyzer features the same correction method as the Generic Signal Analyzer; i.e., sections of the raw signal can be marked for exclusion and interpolation. Due to the way the tonic signal is measured—with a moving minimum filter—it is imperative to remove dipping artifacts, such as those caused by electrode disconnection. See the Basic Tutorial for more information.
SCR Corrections
Additionally, the module includes the ability to add zones in which SCR detection is disabled; referred to as SCR rejection zones. These zones, visualized as red rectangles in the second graph from the top, have two effects:
-
SCR removal:
If an SCR onset or peak lies within the SCR-rejection zone, that SCR is removed. -
Inflection point removal:
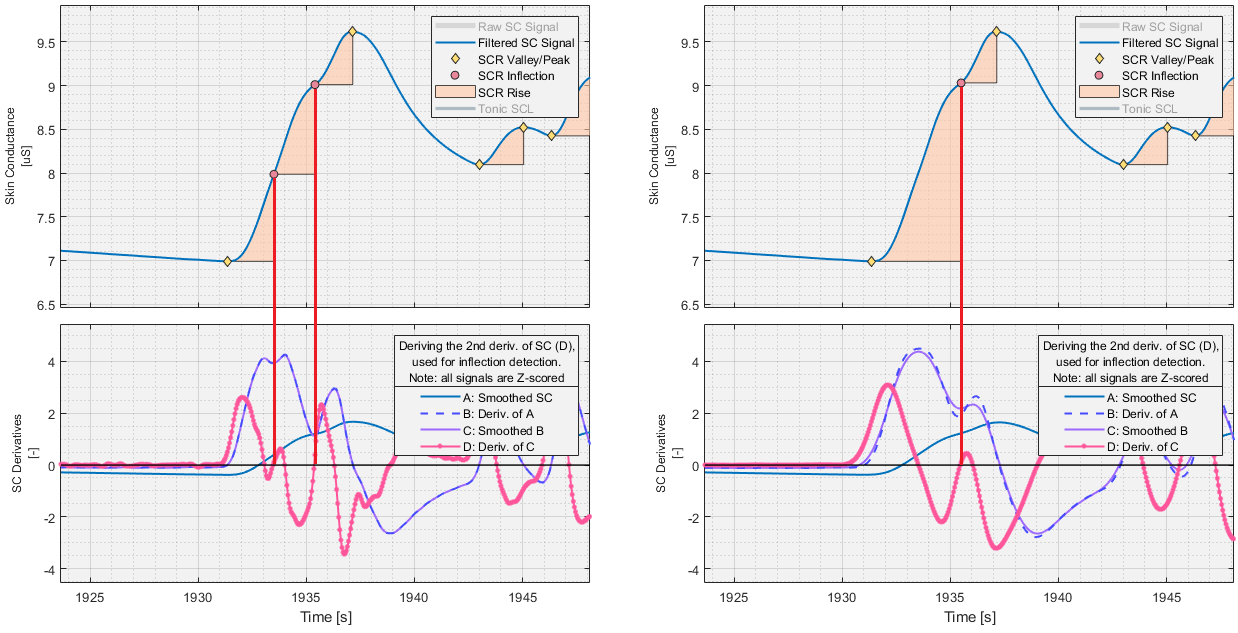
If an inflection point lies within the SCR-rejection zone, it is removed. This effectively merges the SCRs that were split by the inflection zone, see Figure below.

Processing and Analysis Pipeline
The Skin Conductance module uses the following terminology.
-
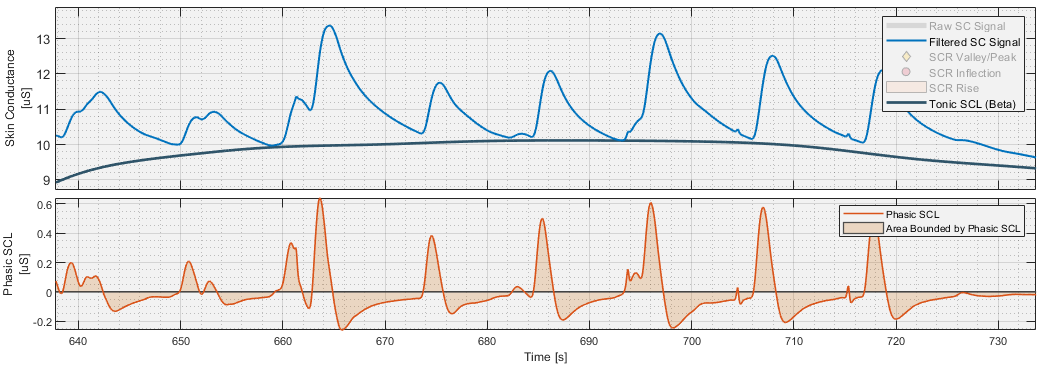
SCL:
The SCL (Skin Conductance Level) refers to the low pass filtered Skin Conductance signal; i.e. it is the smoothed but not decomposed skin conductance signal. The unfiltered signal is referred to as the Raw SCL. -
Tonic SCL:
The Tonic SCL refers to the tonic (slow moving) component of the SCL signal. -
Phasic SCL:
The Phasic SCL refers to the phasic (fast moving) component of the SCL signal. -
SCR:
The SCR (Skin Conductance Response) refers to a section in the SCL signal with a specific shape–namely an upwards hump suggesting a sudden increase in skin conductance activity, followed by a decay. The Toolbox identifies SCRs by scanning the signal for sections that conform to specific SCR definition. Any SCRs that conform are classified, regardless of their proximity to epochs.
Step 1: Filtering the SCL signal
The raw SCL signal is fetched from the specified channel, and if enabled, the shock removal moving median filter is applied. The result is then multiplied by the gain, and if enabled, low pass filtered at the specified cutoff frequency.
It is from this filtered signal that the SCL_filt metrics are calculated.
Step 2: Calculating the Tonic and Phasic signals
First, the filtered SCL signal is resampled using spline interpolation applied to a new 20 Hz time-vector spanning the length of the filtered SCL signal. The tonic SCL signal is then calculated by first applying a moving minimum filter with the user-specifiable window size to the resampled SCL signal, then smoothing the result using a Gaussian kernel of the same window size.
The phasic SCL signal is calculated by applying a 1st order high pass Butterworth filter with the specified cutoff frequency to the down sampled and interpolated SCL signal.
It is from these tonic and phasic signals, which all have 20 Hz resolution, that the SCL_tonic and SCL_phasic metrics are calculated.
Step 3: SCR Detection and Analysis
If enabled, SCRs are detected on the resampled SCL signal described in Step 2, which has a 20 Hz resolution, using the approach described here.
Valley-Peak Pair Detection
Using peak and valley detection, each occurrence of a valley succeeded by a peak, henceforth collectively valley-peak pairs, are identified.
Inflection Point Detection
If superimposed SCR detection is enabled, SCRs are split at inflection points location on their up slope. To find these inflection points, the resampled SCL signal is first smoothed using a Gaussian filter with the user-specified window size, then derived to attain the first time derivative of the SCL, the SCL’. Subsequently, this signal is also smoothed and derived in the same manner to attain the second time derivative of the SCL signal, the SCL’’.
For each previously found valley-peak pair, the section of the SCL’’ signal between the valley and the peak is searched for negative-to-positive zero-crossings. Zero-crossings inside SCR rejection zones are discarded. The remaining negative-to-positive zero-crossings become inflection points, and each valley-peak pair featuring inflection points are split at their respective inflection points, where the inflection point becomes the peak to the previous valley, and the valley to the subsequent peak, forming new valley-peak pairs.
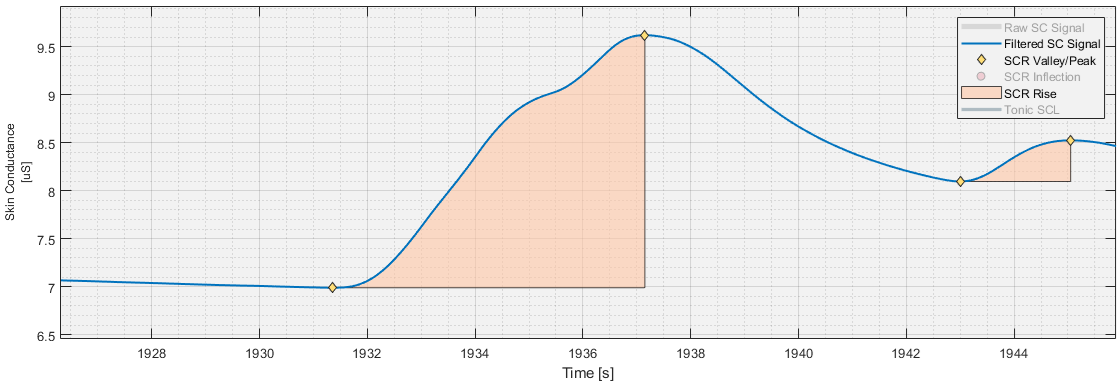
SCR Classification
Valley-peak pairs, which may now include those generated by inflection-point splitting, are filtered using the user-specified amplitude and rise time criteria. Additionally, any valley-peak pair with a valley and/or peak inside an SCR rejection zone is discarded. The remaining valley-peak pairs are classified as SCRs, with the valley being defined as the SCRs onset time, and the peak as its peak.
When assigning SCRs to epochs, an SCR is associated with an epoch if the SCR’s onset time lies within that epoch’s start time plus the user-specified start-latency, and the epoch’s end time plus the specified end-latency. SCRs can belong to multiple overlapping epochs, and as a result of the latency compensation, also to multiple non-overlapping epochs.
Settings
The Skin Conductance analyzer assumes that the unit of the raw signal is µS. If this is not the case, fill in an appropriate gain value (multiplier) to transform the raw signal into µS.
The auto-generated list below shows the settings available in the Skin Conductance Analyzer module:
-
General Settings:
Name, source and epoch settings for this PhysioAnalyzer.-
Analyzer prefix (tag):
The tag (name) of this PhysioAnalyzer. The tag must be unique and start with a letter, and may only contain alphanumeric characters. -
Channel-number of signal:
The channel number (index) of the signal to be analyzed. -
Generate epochs from:
Specifies how epochs are generated.
-
-
Preprocessing Settings:
Settings for processing the raw Skin Conductance signal. This module assumes that the signal is in μS, if it is not, fill in a multiplier (gain) to convert it. The signal is then (optionally) lowpass filtered to produce a smooth Skin Conductance (SC) signal.-
Gain (signal multiplier) [x]:
The gain is the value with which the raw signal is multiplied before being further processed and analyzed. -
Lowpass filter [Hz]:
The low-pass filter and its cutoff frequency.
-
-
SCR Detection Settings:
Skin Conductance Responses (SCRs) are detected using the “valley to peak” method. If enabled, superimposed SCRs are detected by splitting rising SCRs at inflection points. When performing epoch analysis, an SCR is assigned to an epoch if its onset time falls within that epoch’s start time plus the “start-shift”, and that epoch’s end time plus the “end-shift”.-
Detect SCRs in the SC signal [ ]:
Toggles the detection of SCRs. -
Min. and max. SCR amplitude [μS]:
The minimum and maximum allowable SCR amplitude. -
Min. and max. SCR rise time [s]:
The minimum and maximum allowable SCR rise time. -
Derivative smoothing window [s]:
The window length, in seconds, used to smooth the SC and SC’ signals when deriving SC’’. -
Detect superimposed SCRs:
Superimposed SCRs may feature inflections rather than valleys and/or peaks. As such, enabling superimposed SCR detection will split ongoing SCRs at the inflection points. -
Epoch-assignment start/end shifts [s]:
The epoch start and end shifts used when assigning SCRs to epochs (for SCR latency compensation).
-
-
Tonic and Phasic Calculation:
The Toolbox generates a tonic SCL signal by applying moving minimum and gaussian filters to the SC signal. The phasic SCL is generated by high-pass filtering the SC signal.-
Tonic window size [s]:
The window size, in seconds, of the moving minimum and gaussian filters used to generate the tonic SCL signal. -
Phasic highpass filter [Hz]:
The cutoff frequency of the high-pass filter used to calculate the phasic channel.
-
-
Electrical Shock Removal:
If participants underwent electrical stimulation during the data acquisition, electrical spike artifacts that cannot be removed by the lowpass filter may be present in the skin conductance signal. Enable the median filter to remove them.- Median filter window length [ms]:
The window length of the median filter applied to the raw SC signal.
- Median filter window length [ms]:
Metrics
The auto-generated table belows lists all the metrics produced by the Skin Conductance Analyzer module.
Table 1: The metrics calculated by the Skin Conductance Analyzer module.
| Variable: | Unit: | Description: |
|---|---|---|
| SCL_filt_min | uS | The min. of the filtered SCL signal in the current epoch. |
| SCL_filt_max | uS | The max. of the filtered SCL signal in the current epoch. |
| SCL_filt_mean | uS | The mean of the filtered SCL signal in the current epoch. |
| SCL_filt_median | uS | The median of the filtered SCL signal in the current epoch. |
| SCL_filt_std | uS | The standard deviation of the filtered SCL signal in the current epoch. |
| SCL_tonic_min | uS | The min. of the tonic SCL signal in the current epoch. |
| SCL_tonic_max | uS | The max. of the tonic SCL signal in the current epoch. |
| SCL_tonic_mean | uS | The mean of the tonic SCL signal in the current epoch. |
| SCL_tonic_median | uS | The median of the tonic SCL signal in the current epoch. |
| SCL_tonic_std | uS | The standard deviation of the tonic SCL signal in the current epoch. |
| SCL_phasic_min | uS | The min. of the phasic SCL signal in the current epoch. |
| SCL_phasic_max | uS | The max. of the phasic SCL signal in the current epoch. |
| SCL_phasic_mean | uS | The mean of the phasic SCL signal in the current epoch. |
| SCL_phasic_median | uS | The median of the phasic SCL signal in the current epoch. |
| SCL_phasic_std | uS | The standard deviation of the phasic SCL signal in the current epoch. |
| SCL_phasic_area_norm | uS/s | The area under the phasic signal in the current epoch, normalized by dividing it by the epoch duration. |
| SCL_rawSkipZone | % | The percentage of the current epoch in which the raw SC signal was discarded and regenerated using interpolation. |
| SCR_count | n | The count of all SCRs in the current epoch. |
| SCR_first_amp | uS | The amplitude of the first SCR in the current epoch. |
| SCR_first_riseTime | s | The rise time of the first SCR in the current epoch. |
| SCR_first_onsetValue | uS | The onset value of the first SCR in the current epoch. |
| SCR_first_latency | s | The latencies of the first SCR in the current epoch. |
| SCR_amp_min | uS | The min. of the amplitudes of all SCRs in the current epoch. |
| SCR_amp_max | uS | The max. of the amplitudes of all SCRs in the current epoch. |
| SCR_amp_mean | uS | The mean of the amplitudes of all SCRs in the current epoch. |
| SCR_amp_median | uS | The median of the amplitudes of all SCRs in the current epoch. |
| SCR_amp_std | uS | The sample standard deviation of the amplitudes of all SCRs in the current epoch. |
| SCR_riseTime_min | s | The min. of the rise-times of all SCRs in the current epoch. |
| SCR_riseTime_max | s | The max. of the rise-times of all SCRs in the current epoch. |
| SCR_riseTime_mean | s | The mean of the rise-times of all SCRs in the current epoch. |
| SCR_riseTime_median | s | The median of the rise-times of all SCRs in the current epoch. |
| SCR_riseTime_std | s | The sample standard deviation of the rise-times of all SCRs in the current epoch. |
| SCR_onsetValue_min | uS | The min. of the onset values of all SCRs in the current epoch. |
| SCR_onsetValue_max | uS | The max. of the onset values of all SCRs in the current epoch. |
| SCR_onsetValue_mean | uS | The mean of the onset values of all SCRs in the current epoch. |
| SCR_onsetValue_median | uS | The median of the onset values of all SCRs in the current epoch. |
| SCR_onsetValue_std | uS | The sample standard deviation of the onset values of all SCRs in the current epoch. |
| SCR_latency_min | s | The min. of the latencies of all SCRs in the current epoch. |
| SCR_latency_max | s | The max. of the latencies of all SCRs in the current epoch. |
| SCR_latency_mean | s | The mean of the latencies of all SCRs in the current epoch. |
| SCR_latency_median | s | The median of the latencies of all SCRs in the current epoch. |
| SCR_latency_std | s | The sample standard deviation of the latencies of all SCRs in the current epoch. |
| SCR_scrSkipZone | % | The percentage of the current epoch covered in 'Reject SCR' zones. |
| SCR_inflection_userRemoval | n | The number of otherwise present inflection-points that were manually rejected by the user in the current epoch. Note, for this metric, the inflection-point timestamps are assigned to epochs without considering the min. and max. latencies. |
| SCR_userRemoval | n | The number of otherwise valid SCRs manually rejected by the user in the current epoch. |
In addition to the epoch-based metrics above, the Skin Conductance Analyzer also outputs a table with all SCR data.
Table 2: The SCR-specific data. This table is also exported by the module when epoch analysis is run.
| Variable: | Unit: | Description: |
|---|---|---|
| dataSource | filename | The filename of the data source. |
| scrError | Possible error preventing SRCs from being detected. | |
| index | - | The SCR index. |
| totalCount | - | The total number of SCRs in the current signal (see dataSource). |
| onsetTime | s | The onset time of the SCR. |
| riseTime | s | The SCR rise-time. |
| onsetValue | uS | The Skin Conductance value at the SCR onset. |
| amp | uS | The SCR amplitude. |
| isOnsetInflection | Indicates if the onset of the SCR is an inflection. | |
| isPeakInflection | Indicates if the 'peak' of the SCR is an inflection. | |
| inEpoch_name | The name(s) of the epochs that the SCR is assigned to, with the latency range being considered. | |
| inEpoch_count | The number of epochs that the SCR is assigned to, with the latency range being considered. | |
| inEpoch_latency_min | s | The minimum latency of the current SCR, with the latencies being calculated relative to the start times of each epoch that the SCR is assigned to. |
| inEpoch_latency_max | s | The maximum latency of the current SCR, with the latencies being calculated relative to the start times of each epoch that the SCR is assigned to. |
Resampled Signals
When exporting the resampled epoch signals, the Skin Conductance Analyzer resamples and extracts the filtered, tonic and phasic SCL signals.