PhysioData Toolbox
The PhysioData Toolbox is a free easy-to-use and fully graphical application for visualizing, segmenting and analyzing physiological data. It currently supports ECG, Skin Conductance, EMG, ICG, Blood Pressure, Respiration, Pupil Size and Gaze AOI hit data.
Overview
The PhysioData Toolbox is designed to fullfil the following purposes:
-
PhysioData file format:
The Toolbox defines a standard MATLAB-based file format for managing physiological data and analyses (the PhysioData format). -
File Converter:
A File Converter is included that easily converts various raw data formats into PhysioData files. -
Batch import of files:
The Toolbox can import complete folders of PhysioData files and visualize their raw data. -
Batch preprocessing:
Pre-built preprocessing pipelines are packaged as modules and can be easily configured and applied the imported files. See the current modules. -
Visual inspection and artifact removal:
All modules feature easy-to-use interfaces for reviewing the preprocessed data and manually removing artifacts. -
Automatic epoch generation:
Epochs can be automatically generated using user-specified rules, which can reference markers and events inside the data file. -
Batch epoch analysis and resampling:
The Toolbox can automatically summarize or resample all epochs in the imported files, and export the results for further statistical analysis.
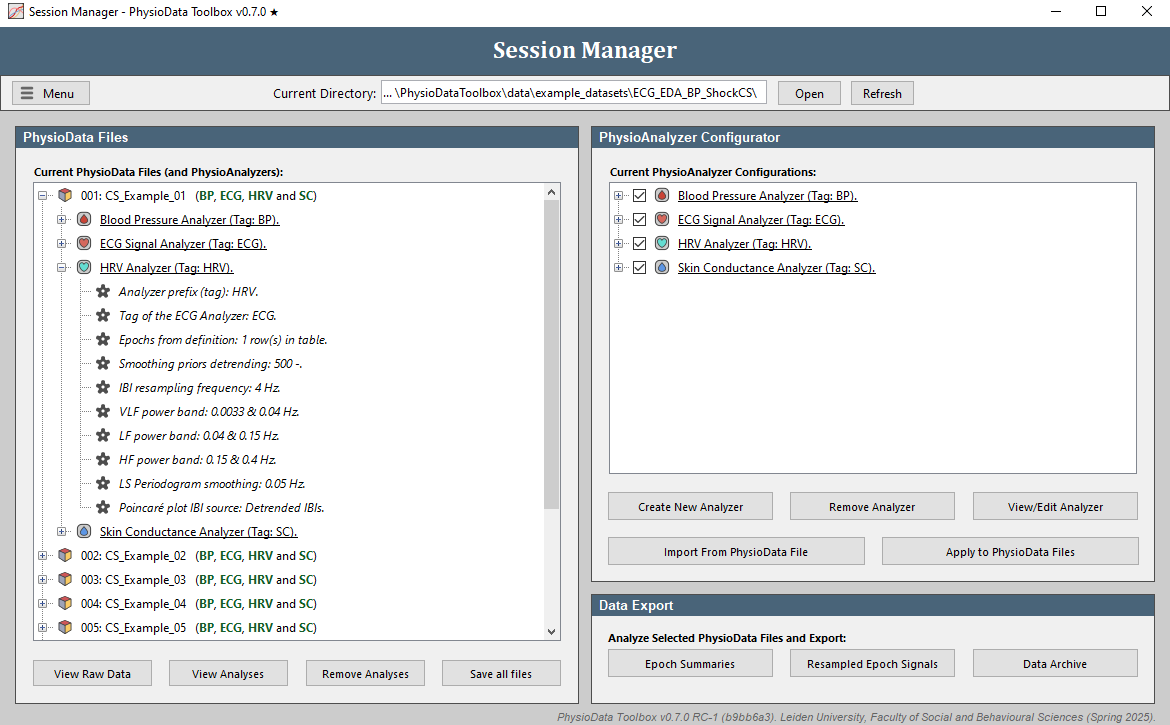
Session Manager
The PhysioData Toolbox is operated using the Session Manager window, which can be used to import multiple files and apply user-specified analysis procedures to them. All files can then be analyzed simultaneously, and their results consolidated into a single table. Additionally, the session can be saved at any time and resumed afterwards. All analysis pipelines are fully parametric and non-destructive.
Modules
The Toolbox features various modules, each containing an adjustable analysis pipeline specific to a certain data type. For the full documentation, see the PhysioAnalyzer page in the User Guide.
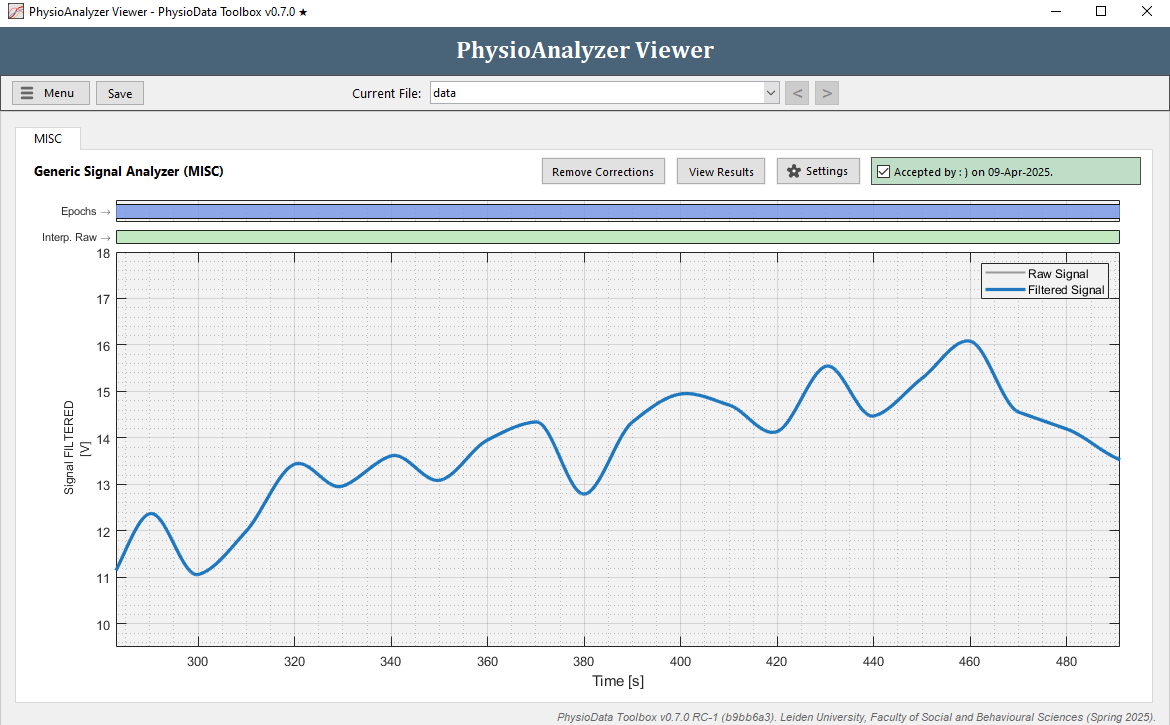
Generic Signal Analyzer
Any generic signal, such as skin temperature, can be analyzed using the Generic Signal Analyzer module, which extracts standard descriptive statistics from the signal per epoch. Additionally, like most other modules, the Generic Signal Analyzer allows the user to perform basic signal correction and artifact rejection.
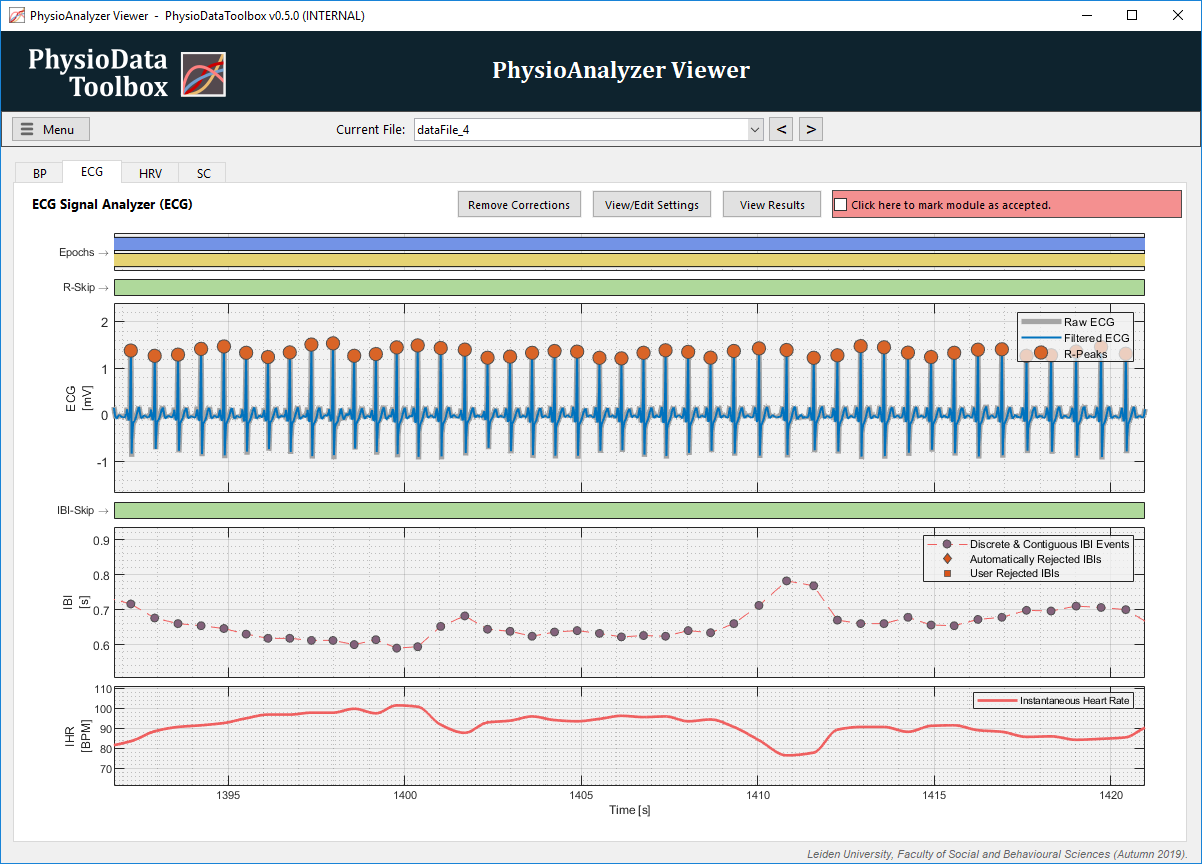
ECG Signal Analyzer
The ECG Signal Analyzer module lets the user preprocess and analyze a raw ECG signal. It can extract various cardiac measures per epoch; such as, mean heart rate, HRV (RMSSD, pNN20 and pNN50), R-peak count, etc. Additionally, the module allows the user to correct misidentified R-peaks and erroneous Interbeat Intervals (IBIs).
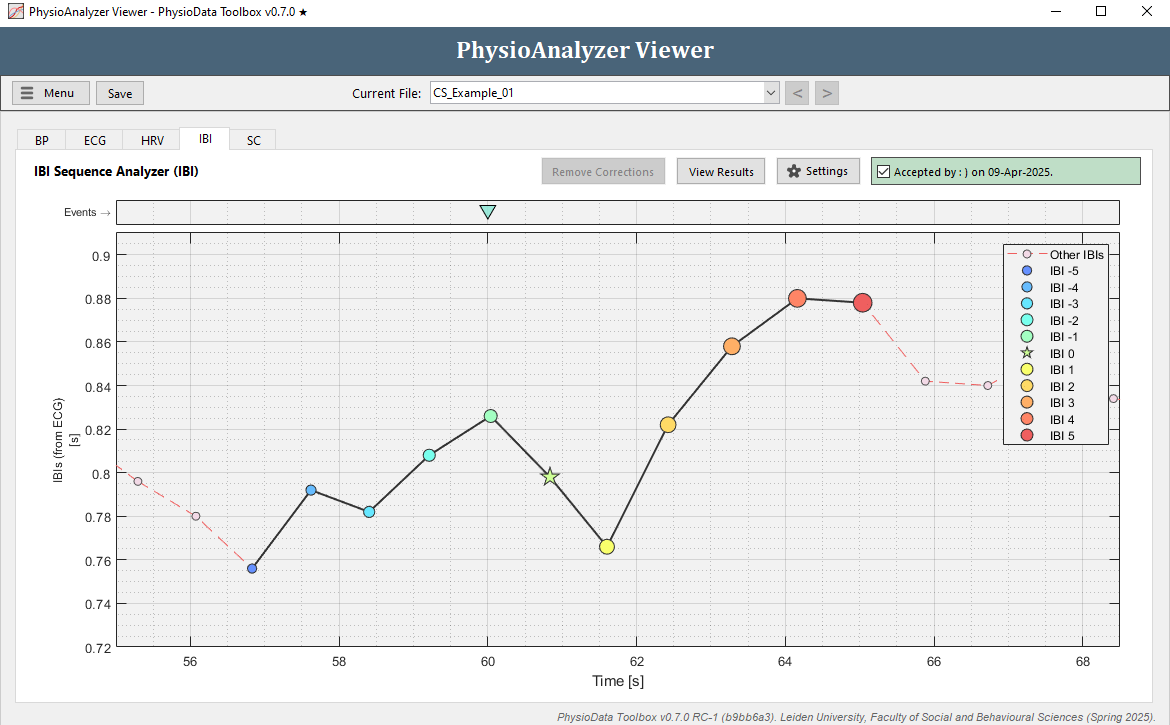
IBI Analyzer
The IBI Analyzer module performs heartbeat locked analysis around user-specified events, which can be used to calculate stimulus specific heart rate acceleration and deceleration.
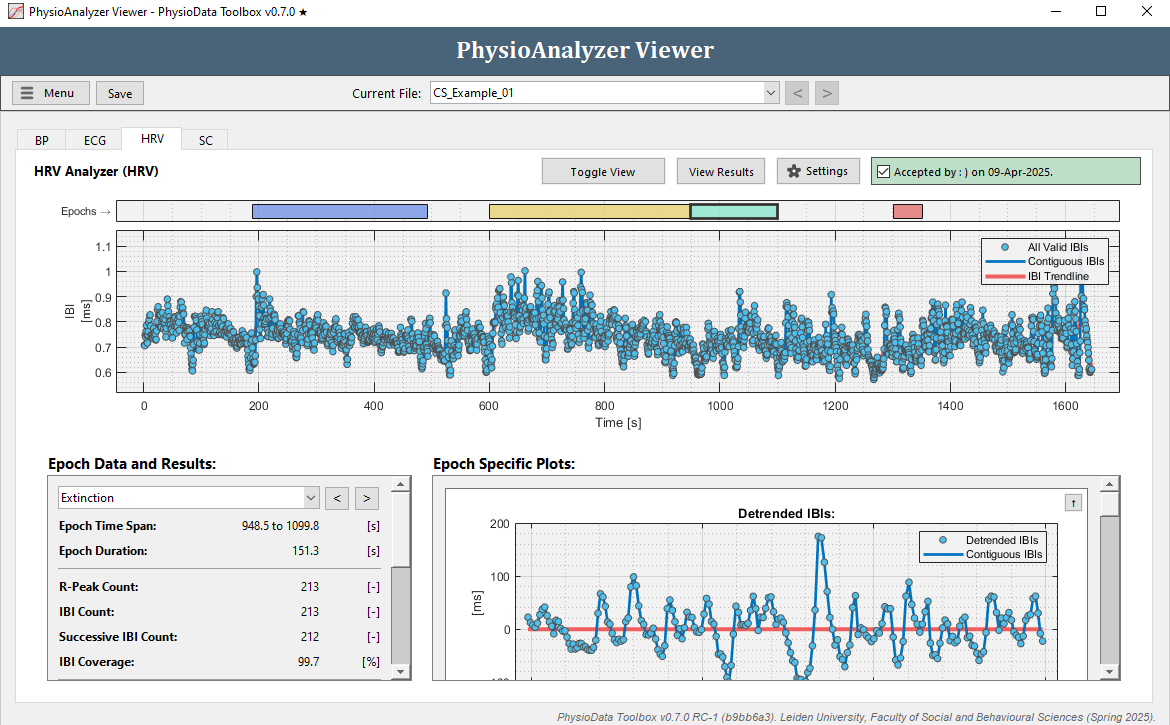
HRV Analyzer
The Heart Rate Variability (HRV) Analyzer retrieves corrected IBI data from a linked ECG module, detrends it, and performs epoch-based analyses to extract several time-domain, frequency-domain and non-linear HRV measures.
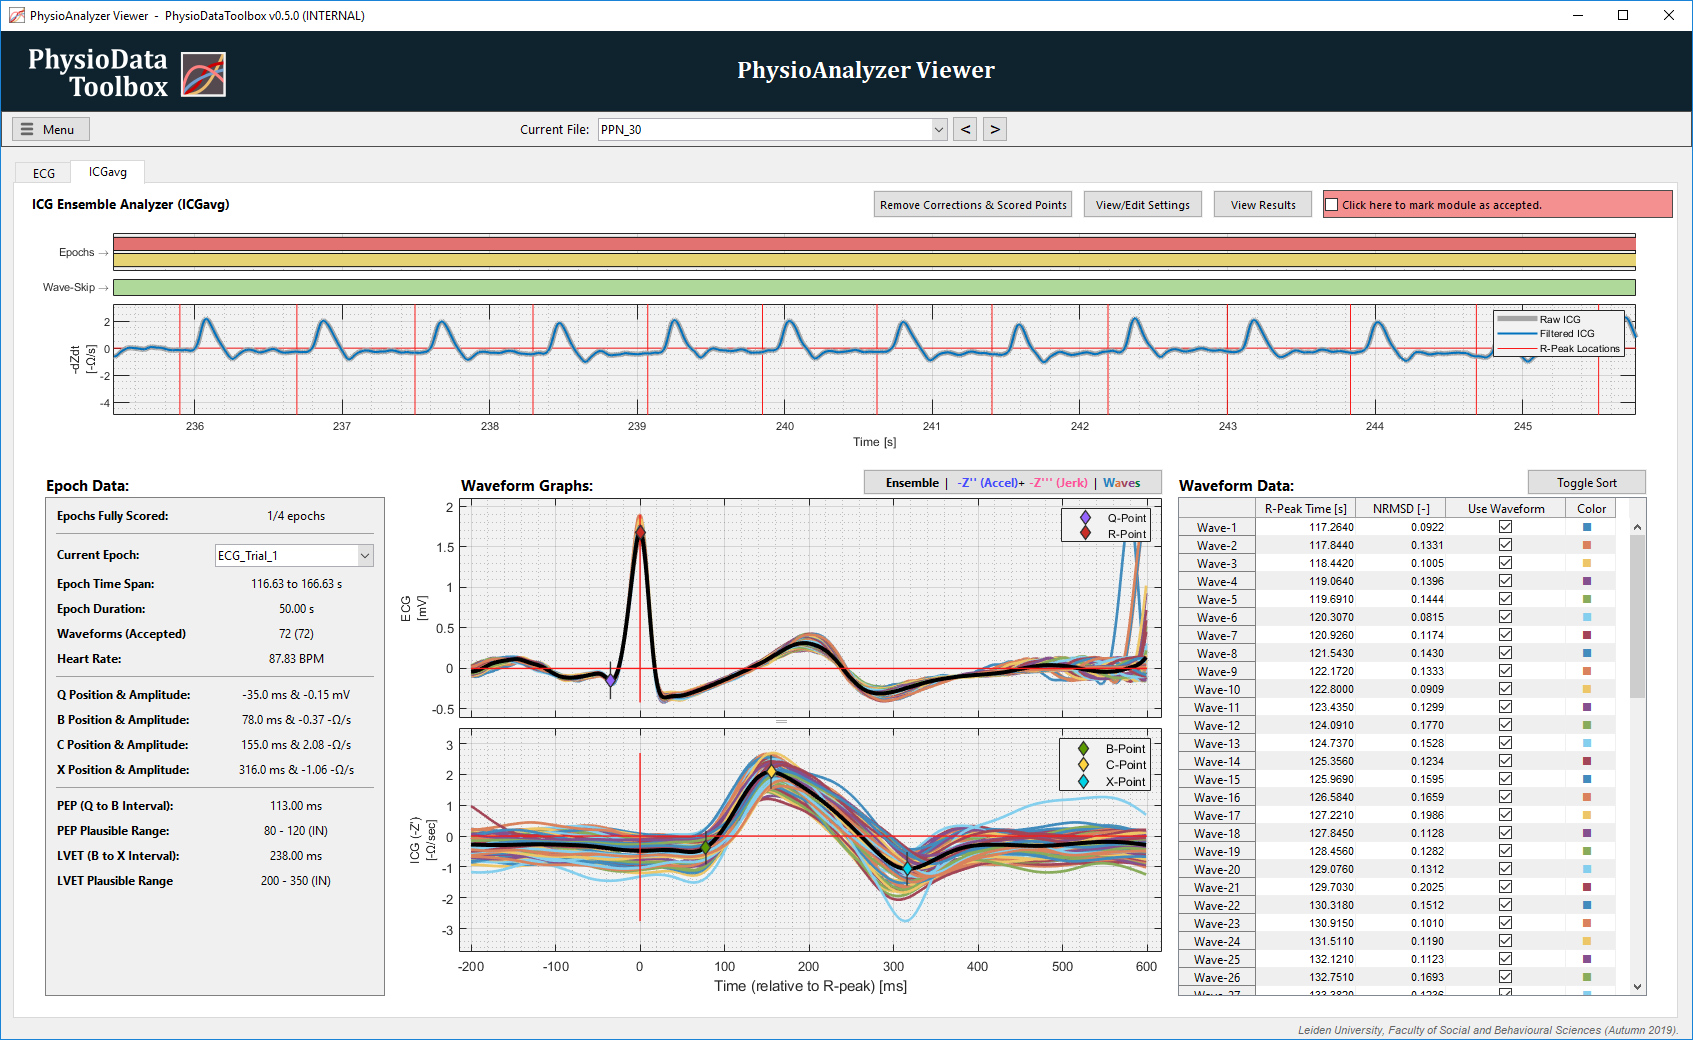
ICG Ensemble Analyzer
The ICG Ensemble Analyzer module generates one ICG and one ECG ensemble waveform per epoch, and allows the user to score the necessary ICG landmarks.
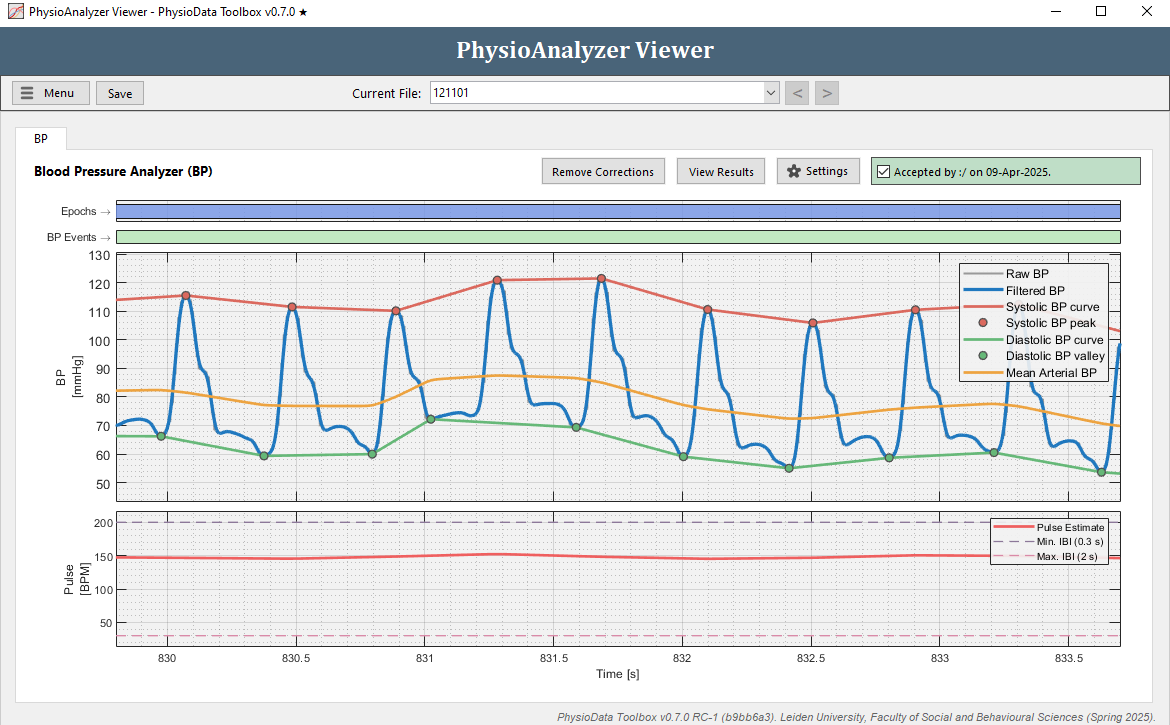
Blood Pressure Analyzer
Standard statistics regarding the systolic, diastolic and mean arterial blood pressures can be extracted using the Blood Pressure Analyzer module.
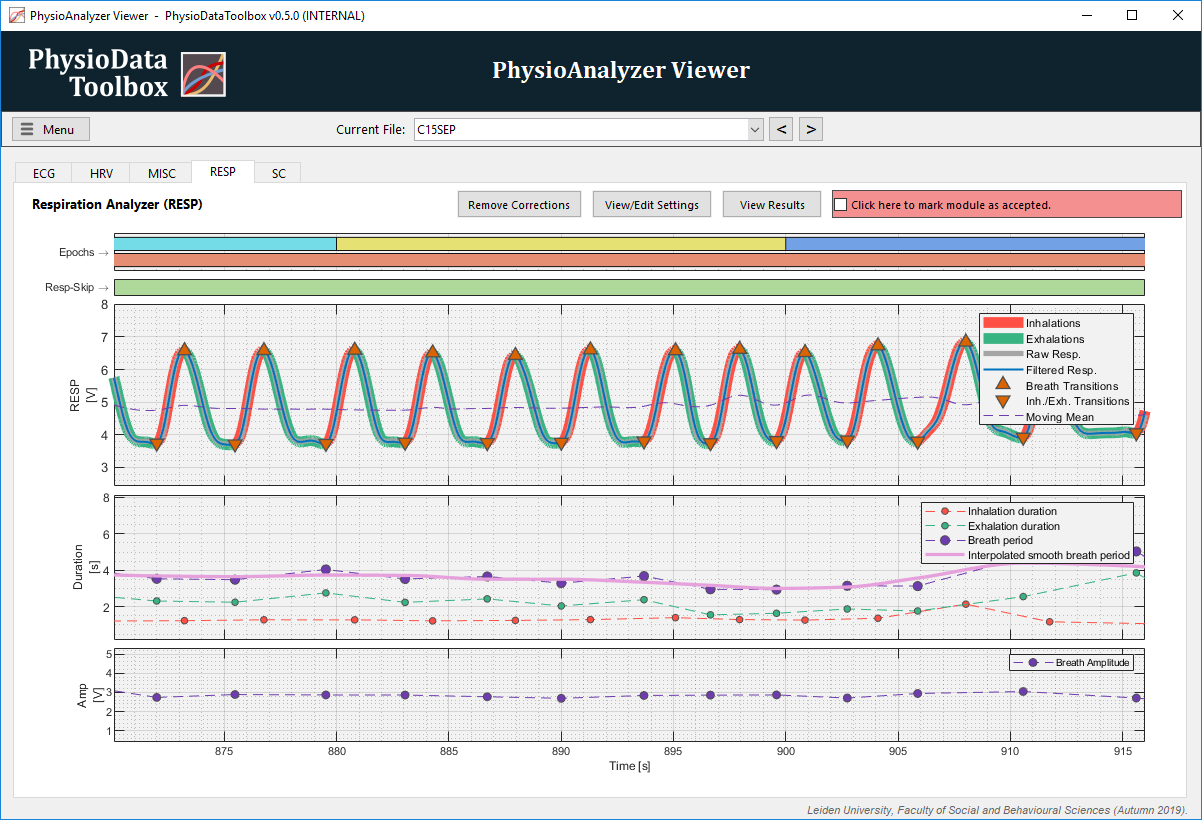
Respiration Analyzer
The Respiration Analyzer lets the user preprocess and analyze a chest or abdomen expansion signal, generated by a force-transducer. The module calculates basic descriptive statistics for inhalation, exhalation, and breath phases, per epoch.
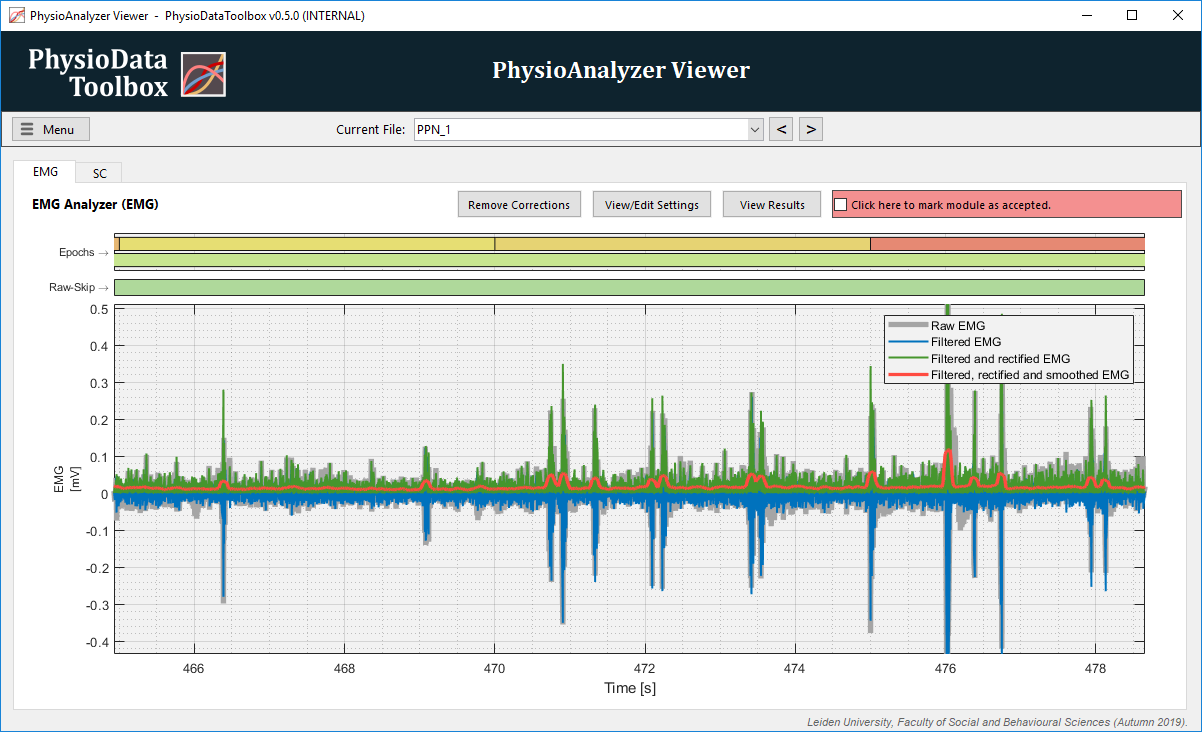
EMG Analyzer
Filtered, rectified and smoothed EMG signals can be extracted from the raw EMG using the EMG Analyzer module, which outputs descriptive statistical analysis of all these derived signals.
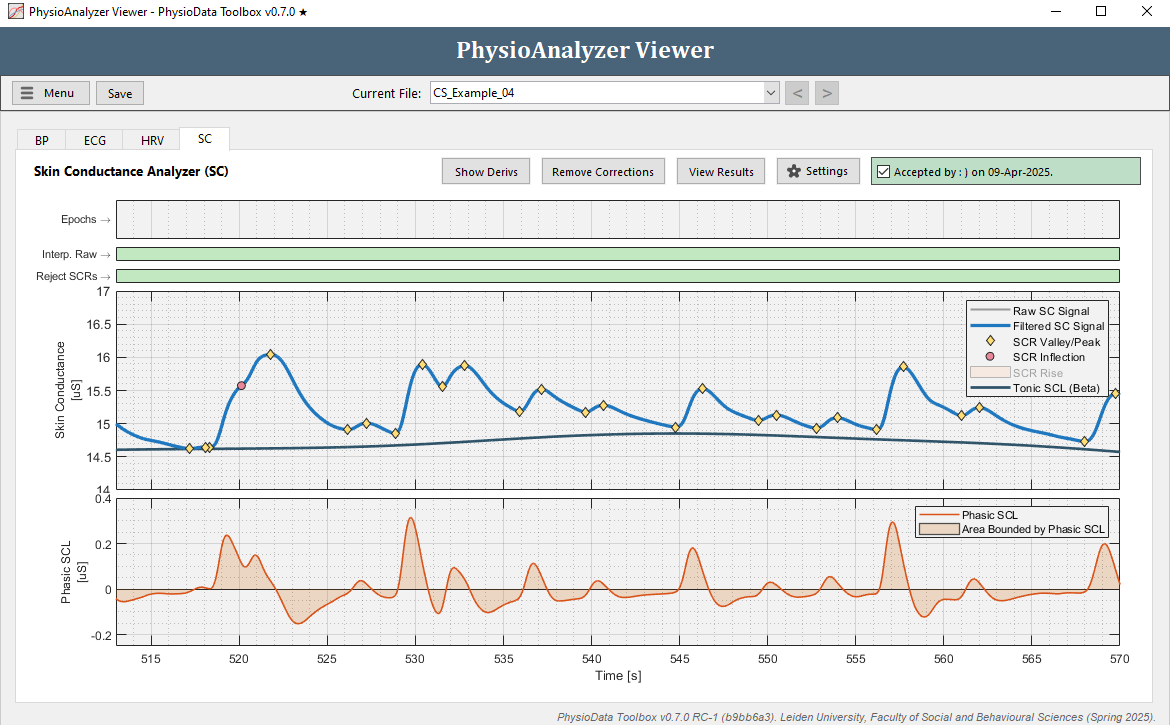
Skin Conductance Analyzer
The Skin Conductance Analyzer module extracts metrics about the skin conductance level (SCL), phasic activity, and Skin Conductance Responses (SCRs) per epoch.
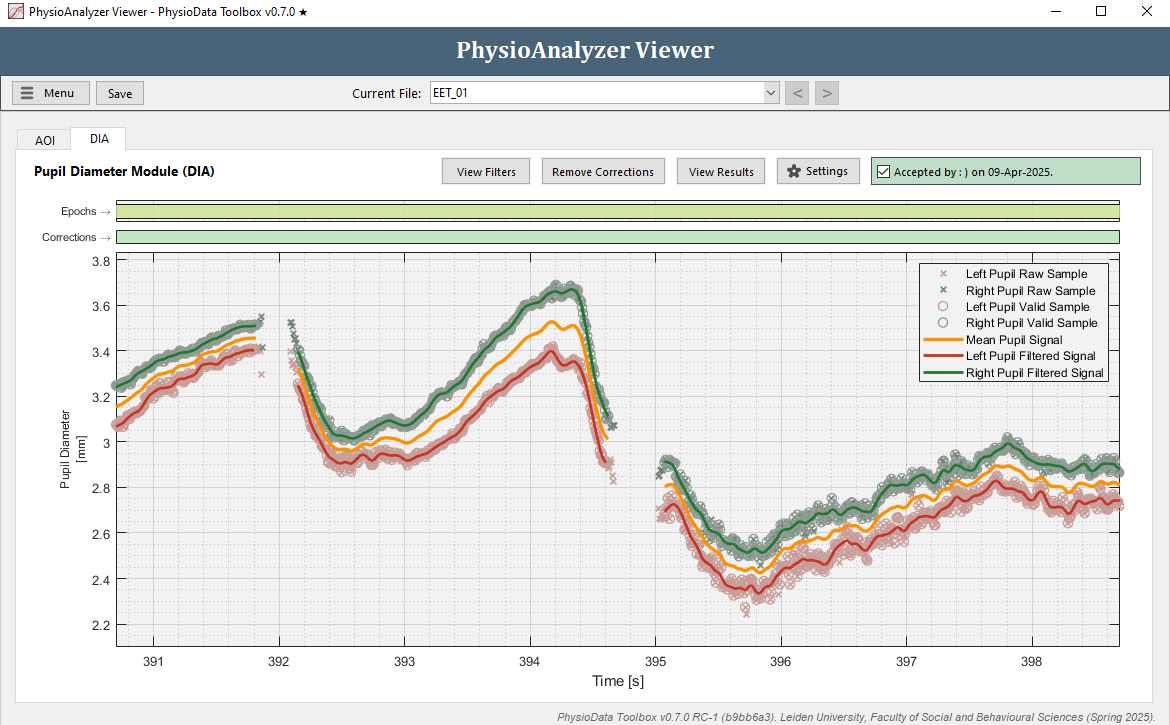
Pupil Diameter Analyzer
The Pupil Diameter Analyzer module features user-specifiable raw data filters and signal interpolation options, and exports a variety of pupil-size metrics.
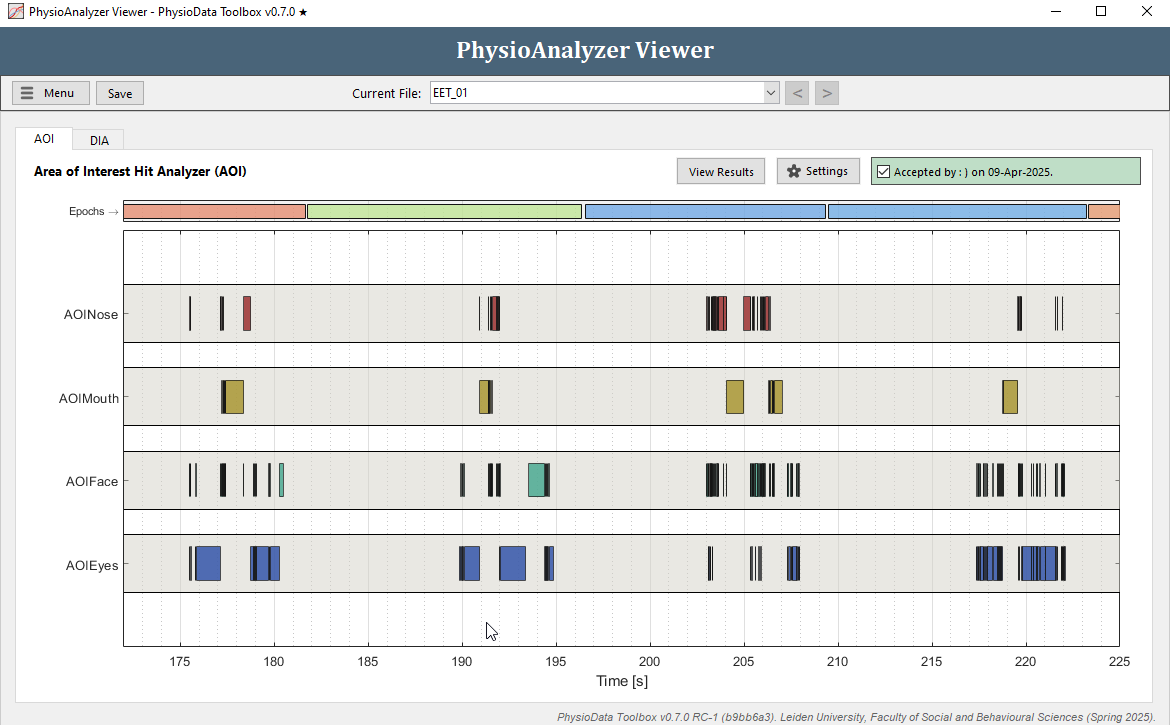
Area of Interest Hit Analyzer
With the Area of Interest Hit Analyzer, gaze data in the shape of area of interest hit data can be analyzed and metrics such as the total hit duration on an area of interest per epoch, can be obtained.